
Analytics, Employment, Labour-market, Latvia, Markets and Companies
International Internet Magazine. Baltic States news & analytics
Friday, 03.05.2024, 01:44
The number of job vacancies in Latvia increased by one fifth in H1
 Print version
In the private sector at the end of June of this year the number of occupied posts was 19.4 thousand or 3.5% more than a year ago reaching 575.4 thousand, but in the public sector the number of occupied posts increased by 4.5 thousand or 1.6% reaching 288.7 thousand.
Most rapidly the number of occupied posts rose in construction sector – by 6.9% (increase of 3.9 thousand), in information and communication sector – by 6.7% (1.5 thousand), in arts, entertainment and recreation sector – by 6.7% (1.4 thousand).
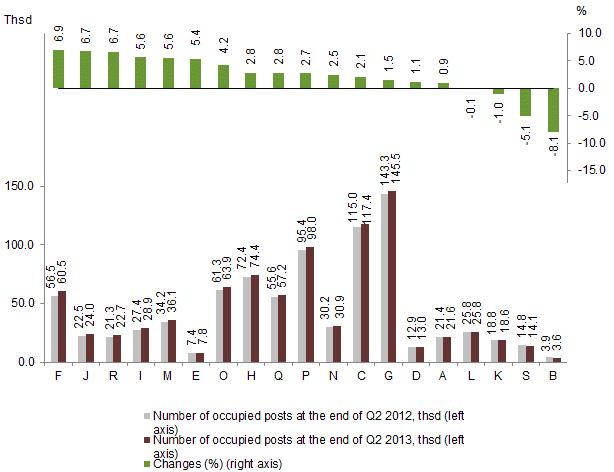 |
| Changes in number of occupied posts over corresponding period of previous year by economic activity* |
Data source: Central Statistical Bureau of Latvia
In major occupational groups the number of occupied posts most rapidly rose in major group of clerks – by 10.8% (increase of 4.5 thousand), in major group of professionals – by 10.2% (13.1thousand) and in major group of plant and machine operators and assemblers – by 9.5% (6.5 thousand).
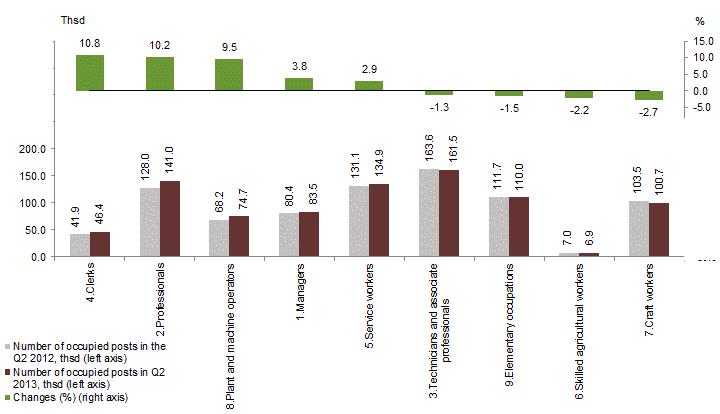 |
| Changes in number of occupied posts by major occupational groups |
But the number of job vacancies at the end of the first half of 2013, compared to the same period of the previous year, has increased by 0.7 thousand or 21.4% reaching 3.9 thousand, of which 2.4 thousand in public sector and 1.6 thousand in private sector.
Job vacancy rate has risen from 0.4% at the end of the June of the last year to 0.5% at the end of the June of this year. In the public sector it has grown from 0.6% to 0.8%, but in the private sector has remained the same – 0.3%.
Occupied posts and job vacancies by sector
|
|
End of Q2 2012 |
End of Q1 2013 ** |
End of Q2 2013 |
Changes of Q4 2013 as % of |
|
|
Q1 2013 |
Q2 2012 |
||||
|
Total in the country |
|
|
|
|
|
|
Number of occupied posts, thsd |
840.2 |
846.0 |
864.1 |
+2.1% |
+2.8% |
|
Number of job vacancies, thsd |
3.2 |
4.2 |
3.9 |
-5.9% |
+21.4% |
|
Job vacancy rate, % |
0.4 |
0.5 |
0.5 |
|
|
|
of which: |
|
|
|
|
|
|
In private sector |
|
|
|
|
|
|
Number of occupied posts, thsd |
556.0 |
561.9 |
575.4 |
+2.4% |
+3.5% |
|
Number of job vacancies, thsd |
1.4 |
1.9 |
1.6 |
-14.9% |
+11.8% |
|
Job vacancy rate, % |
0.3 |
0.3 |
0.3 |
|
|
|
In public sector |
|
|
|
|
|
|
Number of occupied posts, thsd |
284.2 |
284.1 |
288.7 |
+1.6% |
+1.6% |
|
Number of job vacancies, thsd |
1.8 |
2.3 |
2.4 |
+1.2% |
+28.8% |
|
Job vacancy rate, % |
0.6 |
0.8 |
0.8 |
|
|
Explanations
Data on occupied posts and job vacancies are acquired from the quarterly statistical reports on the activities of businesses, individual merchants, state and local government budgetary institutions, foundations, associations and funds as well as from administrative data sources. Only those peasant and fisherman farms employing 50 and more employees are included.
Data on statistical units of the private sector with less than 50 employees, associations and funds are acquired with random sampling, and obtained data with the help of weights are extrapolated on all population, as well as from administrative data sources.
In accordance with the survey methodology, job vacancy is defined as a post for which no contract has been signed and no candidate chosen and the employer is taking active steps to find a suitable candidate from outside the enterprise, and which will be filled immediately or within 3 months. The job vacancy rate is calculated in per cent, by dividing the number of job vacancies by the total number of posts (occupied + vacant).
The public sector includes central and local government institutions and commercial companies with central or local government capital participation 50% and over, public organisations and commercial companies thereof.
Absolute changes and percentage changes are calculated from the data not converted into thousands.
* Sections of economic activities of statistical classification NACE Rev. 2:
A – Agriculture,
forestry and fishing;
B – Mining and quarrying;
C – Manufacturing;
D – Electricity, gas, steam, and air conditioning supply;
E – Water supply; sewerage, waste management and remediation activities;
F – Construction;
G – Wholesale and retail trade; repair of motor vehicles and motorcycles;
H – Transportation and storage;
I – Accommodation and food service activities;
J – Information and communication;
K – Financial and insurance activities;
L – Real estate activities;
M – Professional, scientific and technical activities;
N – Administrative and support service activities;
O – Public administration and defence; compulsory social security;
P – Education;
Q – Human health and social work activities;
R – Arts, entertainment and recreation;
S – Other service activities
** Data are revised.


 «The Baltic Course» Is Sold and Stays in Business!
