
Analytics, Baltic States – CIS, Demography, EU – Baltic States, Latvia, Society
International Internet Magazine. Baltic States news & analytics
Thursday, 07.05.2026, 02:12
International long-term emigration in Latvia indicates reduction, while immigration – rise
 Print version
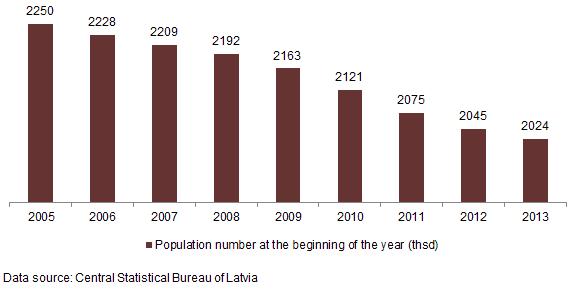 |
| Population number from 2005 till the beginning of 2012 |
During the two years, increase in the population number was recorded in Pierīga region. The share of this region population in the total Latvia population has changed from 17.9% at the beginning of 2011 to 18.3% at the beginning of 2013, while in Latgale region this indicator has dropped from 14.7% to 14.4%, respectively.
One of the factors influencing population number in the country is international long-term migration. CSB has developed migration estimates considering both registered and non-registered migration.
In 2012, 13.3 thousand people arrived to Latvia from other countries (3.1 thousand more than in 2011), while 25.2 thousand people moved from Latvia to permanent residence in other countries (5.1 thousand less than previous year).
________________________
* International long-term migration – movements of the population from one country to another with an aim to change the place of residence permanently or for a period of at least one year.
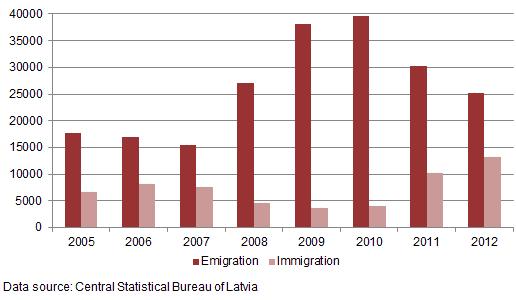
International long-term migration during time period from 2005 to 2012
Females comprised 41% of the total number of people arriving to Latvia, while males - 59%. Half of the immigrants were aged 20-39 (49.8% of males and 50.0% of females).
83.7% of the total immigrant number were at working age (15-61 years). Immigrants were mainly coming from European Union countries (54.9%) and Russia (22.6%).
In 2012, the shares of males and females in the total emigrant number were almost equal - 49.8 % and 50.2%. More than a half of emigrants were aged 20-39 (52.6% of males and 50.4% of females). Most (66.5 %) of the emigrants-females were at fertile age (15-49). 11.1 thousand or 44.1% of the total emigrant number were Latvians (0.9% of the Latvian number at the beginning of 2012) and 8.9 thousand or 35.3% were Russians (1.6% of the Russian number at the beginning if 2012).
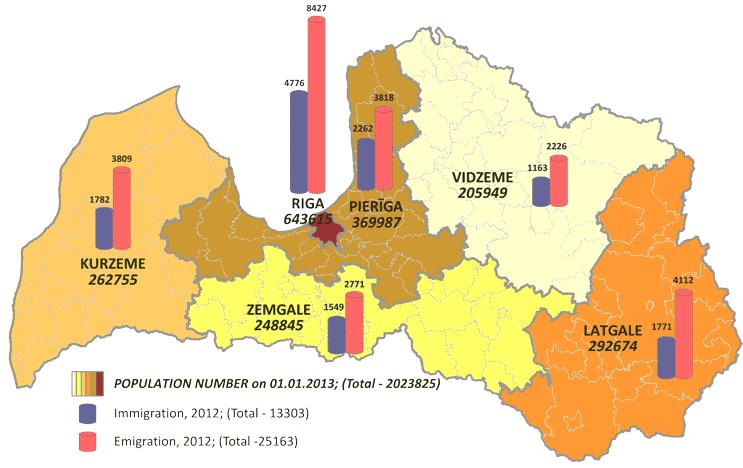
The compiled information indicates that emigrants at working age exceeded the number of immigrants at this age 1.8 times. Analysis of total emigrant flow shows that, in 2012, each third emigrant was Riga resident. Calculation of the emigrant share in the total number of corresponding region residents leads to the conclusion that most of the people were leaving Kurzeme and Latgale regions – 1.4%, while the smallest number were departing from Pierīga – 1.0%. The highest reduction in the population number due to the migration was recorded in Latgale and Kurzeme.
Females comprised 41% of the total number of people arriving to Latvia, while males - 59%. Half of the immigrants were aged 20-39 (49.8% of males and 50.0% of females).
83.7% of the total immigrant number were at working age (15-61 years). Immigrants were mainly coming from European Union countries (54.9%) and Russia (22.6%).
In 2012, the shares of males and females in the total emigrant number were almost equal - 49.8 % and 50.2%. More than a half of emigrants were aged 20-39 (52.6% of males and 50.4% of females). Most (66.5 %) of the emigrants-females were at fertile age (15-49). 11.1 thousand or 44.1% of the total emigrant number were Latvians (0.9% of the Latvian number at the beginning of 2012) and 8.9 thousand or 35.3% were Russians (1.6% of the Russian number at the beginning if 2012).
The compiled information indicates that emigrants at working age exceeded the number of immigrants at this age 1.8 times. Analysis of total emigrant flow shows that, in 2012, each third emigrant was Riga resident. Calculation of the emigrant share in the total number of corresponding region residents leads to the conclusion that most of the people were leaving Kurzeme and Latgale regions – 1.4%, while the smallest number were departing from Pierīga – 1.0%. The highest reduction in the population number due to the migration was recorded in Latgale and Kurzeme.
International migration by region; 2012
|
|
Total |
% of total population on 01.01.2012 |
||||
|
Immigration |
emigration |
net migration |
Immigration |
emigration |
net migration |
|
|
Total |
13 303 |
25 163 |
-11 860 |
0.7 |
1.2 |
-0.5 |
|
Riga |
4 776 |
8 427 |
-3 651 |
0.7 |
1.3 |
-0.6 |
|
Pierīga |
2 262 |
3 818 |
-1 556 |
0.6 |
1.0 |
-0.4 |
|
Vidzeme |
1 163 |
2 226 |
-1 063 |
0.6 |
1.1 |
-0.5 |
|
Kurzeme |
1 782 |
3 809 |
-2 027 |
0.7 |
1.4 |
-0.7 |
|
Zemgale |
1 549 |
2 771 |
-1 222 |
0.6 |
1.1 |
-0.5 |
|
Latgale |
1 771 |
4 112 |
-2 341 |
0.6 |
1.4 |
-0.8 |
Population number and migration data calculations are based on new CSB methodology for population number estimates. Methodology engages administrative data, and it has been developed by consulting Latvian and foreign experts.
The method was worked out as the number of Latvia population does not meet the number of declared population in the Population Register of the Office of Citizenship and Migration Affairs, as it is in, e.g., Scandinavian Countries, Finland, Netherlands, or Slovenia. Moreover, Latvian and foreign data users need more detailed information, therefore population number estimates at necessary level of detailed elaboration can not be provided by using information from the CSB sample surveys. Utilisation of the new methodology allows acquiring detailed information on both number of resident population and migration.
Methodological description is available in the CSB website.
 |
| Latest information on population number, migration and emigration |


 «The Baltic Course» Is Sold and Stays in Business!
