
Analytics
International Internet Magazine. Baltic States news & analytics
Saturday, 27.06.2026, 01:21
Annual deflation registered in Latvia in May
 Print version
Prices of both goods and services have diminished by 0.1%. The average level of consumer prices during the last 12 months has increased by 1.0%, as compared to the corresponding period of the previous year.
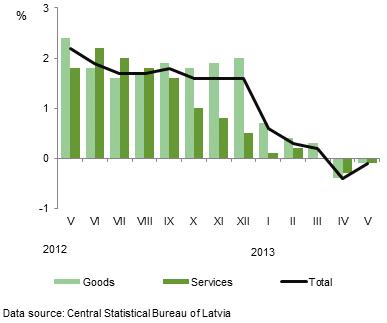 |
| Changes in consumer prices in 2012 and 2013
(% over corresponding month of the previous year) |
The greatest downward pressures on the consumer prices in May 2013, as compared to May 2012, were put by prices of transport goods and services as well as prices of communication services, whereas food prices had the most significant upward impact.
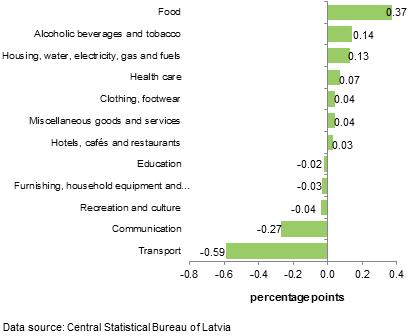 |
| Consumer price changes by commodity group, last 12 months (percentage points) |
In the food commodity group, increase was recorded in the prices of vegetables (+15.2%), fresh meat (+4.2%), cookies and confectionery (+3.7%), as well as fruit (+2.6%), whereas the most notable reduction was observed in the prices of tea and coffee (-5.9%), eggs (-9.9%), bread (-3.2%), as well as milk and dairy products (-1.4%).
Transport group indicates a drop in the average annual prices of fuel (-6.2%) and passenger cars (-4.7%).
Prices of telecommunication services diminished by 6.8%. Notable price increases among other consumption groups were recorded in the prices of house maintenance services, tobacco, and clothing. Prices of TV, video, audio, photo, and data processing equipment reduced.
In comparison with the previous month, consumer prices in May have grown by 0.1%. Average level of prices of goods stayed stable, whereas prices of services rose by 0.3%.
The greatest upward pressures on the consumer prices during the month were put by the prices of food, alcoholic beverages and tobacco, while downward – by the prices of goods and services related to transport.
Under seasonal influence, prices of vegetables rose on average by 7.2%. Growth was observed also in prices of fruit (+3.5%), juices and refreshing beverages (+2.9%), while reduction was recorded in prices of bread (-5.9%), milk and dairy products (-1.6%), tea and coffee (-3.5%). Prices of alcoholic beverages, especially of spirits and beer, increased (+0.9%).
Within the transport group, drop was observed in the prices of fuel (-2.6%) and airline tickets (-1.5%).
Notable increases among other consumption groups were recorded in the prices of clothing as well as house maintenance services; whereas reduction was recorded in the prices of individual care goods.
Consumer price changes by commodity group, %
|
Commodity group |
Price changes in May 2013, compared to |
||
|
May 2012 |
December 2012 |
April 2013 |
|
|
Total |
-0.1 |
0.3 |
0.1 |
|
Food and non-alcoholic beverage |
1.5 |
1.4 |
0.3 |
|
Alcoholic beverages and tobacco |
1.7 |
2.3 |
0.8 |
|
Clothing and footwear |
0.4 |
4.2 |
0.6 |
|
Housing, water, electricity, gas and fuels |
0.7 |
-0.9 |
0.2 |
|
Furnishing, household equipment and operation |
-0.7 |
0.9 |
0.8 |
|
Health care |
1.2 |
0.7 |
0.0 |
|
Transport |
-4.3 |
-2.6 |
-1.2 |
|
Communication |
-6.8 |
-0.3 |
-0.1 |
|
Recreation and culture |
-0.5 |
-0.5 |
0.1 |
|
Education |
-1.1 |
-0.1 |
0.0 |
|
Hotels, cafés and restaurants |
0.8 |
0.2 |
0.5 |
|
Miscellaneous goods and services |
0.8 |
0.5 |
-0.6 |
Sub-indices having the greatest impacts, percentage points
|
During a month |
|
|
Vegetables |
+0.17 |
|
Clothing |
+0.06 |
|
Fruit |
+0.06 |
|
House maintenance services |
+0.05 |
|
Beer |
+0.04 |
|
Milk, cheese and eggs |
-0.05 |
|
Bread and cereal products |
-0.11 |
|
Fuels for transport |
-0.15 |
|
During 12 months |
|
|
Vegetables |
+0.34 |
|
House maintenance services |
+0.12 |
|
Tobacco |
+0.10 |
|
Meat and meat products |
+0.10 |
|
Motor cars |
-0.10 |
|
Milk, cheese and eggs |
-0.11 |
|
Telecommunication services |
-0.26 |
|
Fuels for transport |
-0.39 |
More detailed information on consumer price changes is available in the CSB database.
1 The annual measure of inflation that is used to compare average monthly price level with the average price level in the corresponding month of the previous year.
2 The average annual measure of inflation that is used to compare the average price level of the last 12 months with the average price level in 12 months of the previous year; employed in Maastricht inflation criteria estimates.


 «The Baltic Course» Is Sold and Stays in Business!
