
Analytics, Demography, EU – Baltic States, Latvia, Society, Statistics
International Internet Magazine. Baltic States news & analytics
Friday, 26.06.2026, 23:17
In 2000-2010, population in Latvia diminished by 307 thousand or by 12.9%
 Print version
Basing on the revised population number also crude rates of demography statistics prior published on the CSB webpage were re-calculated (e.g., birth and death rates, life expectancy at birth).
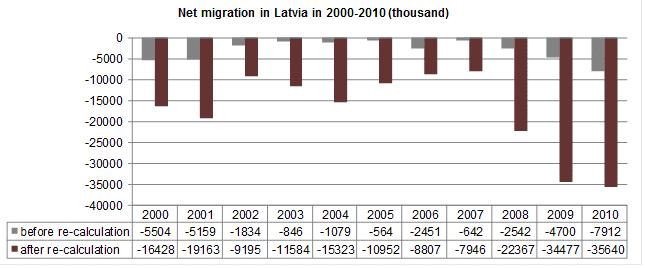
1. Acquired results in respect to the net migration and revised numbers thereof have been depicted below. Consequences of the economic crisis inevitably are reflected by the rapid rise of the net migration in 2009 – 2010.
2. Prevalence of
the emigration over immigration considerably influenced population number. Since
2008 net migration comprises more than two thirds (77%) of the total population
decrease.
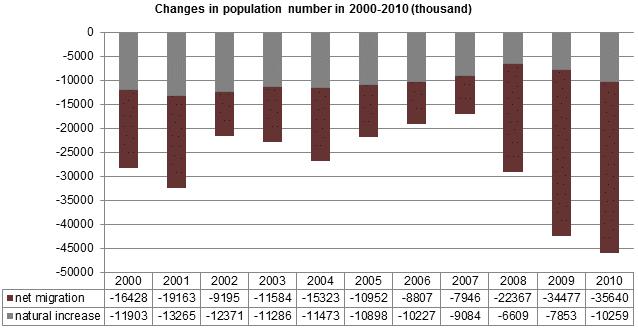
During the time period from 2000 till 2010 total population number in Latvia has diminished by 307 thousand or by 12.9%, of which by 115 thousand due to negative natural increase and by 192 thousand because of the migration. In 2011 population number has reduced by 33 thousand, of which by 10 thousand due to negative natural increase and by 23 thousand because of migration.
3. Along with the changes in population number also crude indicators have changed – e.g., birth and death rates were recalculated as well.
Re-calculated crude birth rate in 2010 comprised 9.4 children per 1000 population (8.6 before re-calculation); whereas in 2011 crude birth rate in Latvia accounted for 9.1.
Indicator characterising generational change is total fertility rate – average number of children that would be born to a female during her lifetime provided the birth-rate of the given year remaining at the previous level. Indicator necessary for normal generational exchange is 2.1 children.
The highest indicator was reached in 2008 – 1.59 children (it meets the average European Union (EU) indicator) (1.45 before re-calculation). In 2010, in Latvia this indicator fell down to 1.36 children (1.18 before re-calculation).
In comparison, total fertility rate in 2011 comprised 1.34 children.
4. Birth indicators are improving after the population number re-calculation, whereas opposite situation can be observed in respect to the mortality, as number of deaths is attributed to the smaller population number.
Also here an important indicator is crude death rate – number of deaths per 1000 population. The highest indicator was recorded in 2007 – 15.0 deaths per 1000 population, while in 2010 – 14.3 (13.9 in 2011). It still is one of the highest indicators in EU.
5. Performance indicator characterising demographic situation is average life expectancy. During the time period from 2000 till 2010, life expectancy at birth for females has increased by 2 years and in 2010 it comprised 78 years, while for males it has grown by 3 years and in 2010 it accounted for 68 years. After re-calculation of the population number life expectancy indicators published prior have slightly reduced –e.g., by 0.5 years in 2010 (by 0.7 years for males and by 0.3 years for females). Life expectancy at birth in 2011 comprised 69 years for males and 79 years for females.
More information are available on CSB database.


 «The Baltic Course» Is Sold and Stays in Business!
