
Analytics, Construction, Lithuania, Real Estate
International Internet Magazine. Baltic States news & analytics
Sunday, 21.06.2026, 09:55
Construction input prices in Lithuania increased by 3.2% in June y-o-y
 Print version
Over the month, the largest increase was observed in prices for the construction of residential buildings – by 1.3%, repair of buildings – 1.4%.
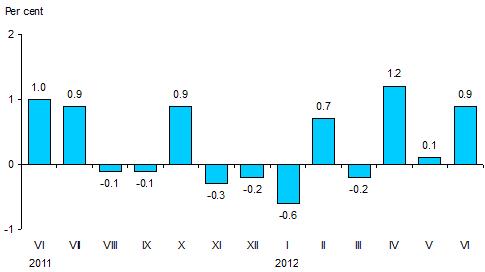 |
| Fig. 1. Monthly changes in construction input prices, compared to the previous month |
As for building materials and products, the highest increase in prices over a month was observed in prices for concrete and reinforced concrete products – by 0.7%, metallic products – 0.4%, electrical engineering materials and wood products – 0.2%, decrease – in prices for insulation materials and various types of concrete and mortar (by 0.3% each).
Over a year (in June 2012, against June 2011), construction input prices increased by 3.2%. The annual price change was determined by an increase in prices for building materials and products – by 3.6%, wages and salaries – 2.8%. As for building materials and products, the most noticeable increase was observed in prices for various types of concrete and mortar – by 7.4%, concrete and reinforced concrete products – 6.7%, general building materials – 5.2%, finishing materials – 4.5%, metal products – 4%, insulation materials – 3%.
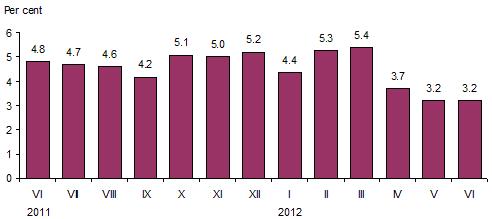 |
| Fig. 2. Annual changes in construction input prices, compared to the same month of the previous year |
Table 1. Changes in construction input prices by type of structure, June 2012, %
|
Types of structures according to CC |
Relative share of the construction works carried out by type of structure in the total value of new construction |
Price growth in June 2012, against |
||
|
May 2012 |
2011 |
|||
|
December |
June |
|||
|
All structures |
100.0 |
0.9 |
2.1 |
3.2 |
|
Residential buildings |
9.7 |
1.3 |
2.1 |
2.3 |
|
Non-residential buildings |
33.4 |
1.0 |
1.9 |
2.8 |
|
Administrative |
10.9 |
1.0 |
2.0 |
2.5 |
|
Industrial |
15.6 |
1.0 |
1.9 |
2.8 |
|
Trade |
6.9 |
0.8 |
1.8 |
3.2 |
|
Civil engineering units |
56.9 |
0.8 |
2.2 |
3.5 |
|
Utility infrastructure (except waste water pipelines) |
29.1 |
0.9 |
1.3 |
1.9 |
|
Waste water pipelines |
9.9 |
1.1 |
3.3 |
4.0 |
|
Roads and streets |
17.9 |
0.4 |
3.0 |
6.0 |
|
In addition, renovation |
x |
1.4 |
2.0 |
1.9 |
x – the indicator is not calculated in such expression.
Table 2. Changes in prices for the main components of construction input, June 2012, %
|
Groups of construction input components |
Relative share of construction input in the total value of construction |
Price growth, drop (–) in June 2012, against |
||
|
May 2012 |
2011 |
|||
|
December |
June |
|||
|
Total construction costs |
100.0 |
0.9 |
2.1 |
3.2 |
|
Materials and products |
62.7 |
0.1 |
1.7 |
3.6 |
|
Operation of machines and mechanisms |
8.1 |
0.0 |
1.6 |
2.7 |
|
Wages and salaries and overheads |
29.2 |
2.9 |
3.1 |
2.3 |
|
Wages and salaries |
24.3 |
3.4 |
3.9 |
2.8 |
|
Overheads |
4.9 |
-0.1 |
-1.6 |
-0.3 |
Table 3. The influence of construction input prices on the overall monthly price change (in June 2012, against May)
Percentage points
|
Groups of construction input components |
Influence |
Groups of construction input components |
Influence |
|
Wages and salaries |
+0.864 |
Overheads |
-0.005 |
|
Materials and products |
+0.055 |
Machine and mechanisms labour |
-0.001 |
The influence on the overall change in construction input prices is determined not only by the rate of change of the construction input component price but also by the relative share of that component in the total value of construction.
CC refers to the Classification of Types of Construction.


 «The Baltic Course» Is Sold and Stays in Business!
