
Analytics, Economics, GDP, Latvia, Markets and Companies
International Internet Magazine. Baltic States news & analytics
Wednesday, 29.07.2026, 05:48
GDP of Latvia increased by 5.5% in 2011
 Print version
In comparison with the 3rd quarter of 2011, the GDP in the 4th quarter of 2011 has risen by 1.1%, according to seasonally adjusted data.
|
Year |
Gross Domestic Product (seasonally non-adjusted data) |
Gross Domestic Product per capita* |
|||
|
mlnLVL |
at constant prices, as % over corresponding period of previous year |
LVL |
|||
|
at current prices |
at constant prices of 2000 |
at current prices |
at constant prices of 2000 |
||
|
2010 |
12 739 |
6 765 |
99.7 |
… |
… |
|
1st quarter |
2 845 |
1 475 |
94.5 |
… |
… |
|
2nd quarter |
3 147 |
1 666 |
96.5 |
… |
… |
|
3rd quarter |
3 293 |
1779 |
103.5 |
… |
… |
|
4th quarter |
3 454 |
1 845 |
103.6 |
… |
… |
|
2011 |
14 161 |
7 135 |
105.5 |
6 862 |
3 457 |
|
1st quarter |
3 046 |
1 527 |
103.5 |
1 470 |
737 |
|
2nd quarter |
3 505 |
1 760 |
105.6 |
1 698 |
853 |
|
3rd quarter |
3 706 |
1 897 |
106.6 |
1 800 |
921 |
|
4th quarter |
3 903 |
1 951 |
105.7 |
1 900 |
950 |
* GDP per capita was re-calculated in compliance with the provisional results of the Population and Housing Census 2011. Data on the GDP per capita for the time period 2001 – 2010 will be available in September 2012.
Production approach
In 2011 the GDP changes were due to the increase in following sectors:trade (share in the GDP structure – 16.9%) – by 8.7%, manufacturing (14.1%) – by 11.7%, and transport and storage (13.0%) – by 8.0%. Accommodation services have witnessed a growth of 23.6%, whereas catering services – of 21.5% (total share of the sector in the GDP comprises 1.7%). In construction (6.1%) the increase constituted 12.4%.
In comparison with the 4th quarter of 2010, in the 4th quarter of 2011 a volume growth of 8.5% was recorded in the trade sector, in manufacturing – of 9.1%, while in transport and storage – of 7.5%. The accommodation sector witnessed a growth of 15.8%, whereas catering services – of 20.8%. Notable increase was recorded in construction – of 25.9%.
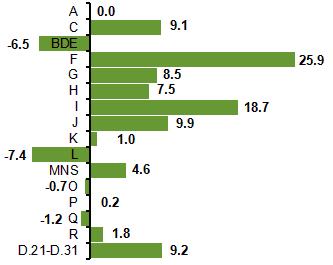 |
| Changes of GDP in the 4th quarter of 2011 by kind of economic activity (NACE Rev. 2, at constant prices, % of the corresponding quarter of the previous year) |
A agriculture,
hunting and forestry;
C manufacturing;
BDE other
manufacturing;
F construction;
G wholesale,
retail trade; repair of motor vehicles, motorcycles, personal, household goods;
H transport and
storage;
I accommodation
and food service activities;
J information
and communication;
K financial and
insurance activities;
L real estate
activities;
MNS business
activities;
O public
administration and defence; compulsory social security;
P education;
Q human health
and social work activities;
R arts,
entertainment and recreation;
D.21-D.31 product
taxes minus subsidies
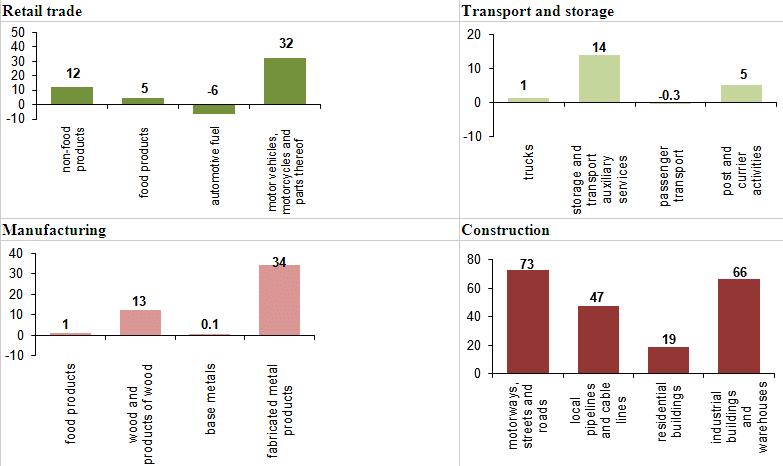 |
| Changes in key sectors in the 4th quarter of 2011 (at constant prices, % of the corresponding quarter of the previous year) |
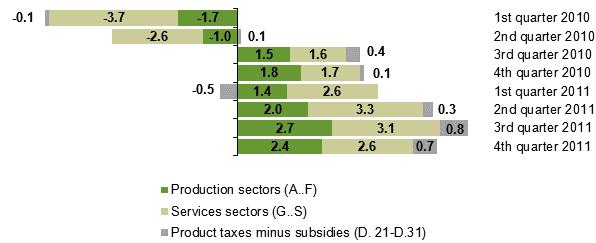 |
| Impact of production approach components on changes of Gross Domestic Product (at constant prices, percentage points) |
Expenditure approach
Private final consumption (at current prices) in 2011 has grown by 9.6%. The most notable expenditure in private final consumption was required by transport, it rose by 17.6%, food (by 9.1%), as well as housing maintenance (by 8.8%). Gross capital formation rose by 27.1%, import – by 27.2% and export – by 22.6%. Whereas government final consumption reduced by 0.8%.
In comparison with the 4th quarter of 2010, private final consumption in the 4th quarter of 2011 rose by 8.8%. The most notable expenditure in private final consumption was required by transport, it rose by 16.2%, food (by 13.4%), as well as housing maintenance (by 4.9%). Gross capital formation increased by 26.0%, while import and export by 17.0% and 16.2%, respectively. Government final consumption has diminished by 0.9%.
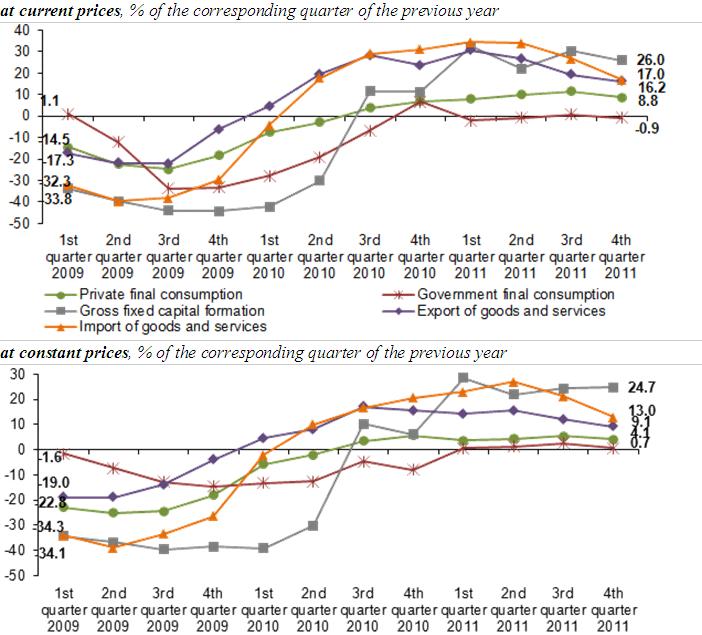 |
| Increase of the Gross Domestic Product by main expenditure item |
Purchase volume in the private final consumption (at constant prices) in 2011 has grown by 4.4%. Expenditure on gross capital formation rose by 24.6%, but government final consumption – by 1.3%. Export of goods (72.2% of total exports) has increased by 12.0% and the export of services – by 14.0%. However, the volume of import of goods (83.6% of total import) has grown by 23.0%, but volume of import of services has risen by 9.1%.
Compared to the 4th quarter of 2010, private final consumption in the 4th quarter of 2011 has grown by 4.1%, gross capital formation – by 24.7%, while government final consumption – by 0.7%. Export of goods (71.4% of total exports) has increased by 6.6% and the export of services – by 15.8%. Import of goods (83.2% of total imports) has risen by 14.3%, while import of services – by 6.7%.
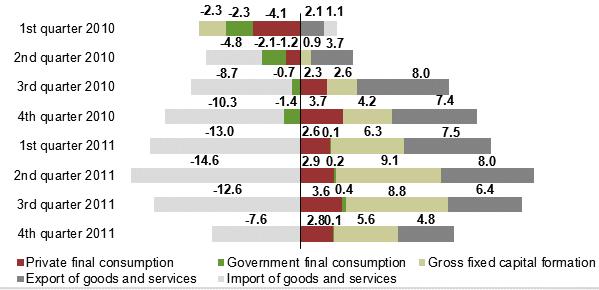 |
| Impact of expenditure approach components on changes of Gross Domestic Product (at constant prices, percentage points) |
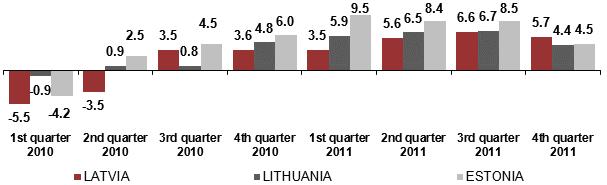 |
| Changes of Gross Domestic Product in the Baltic States (at constant prices, % of the corresponding period of the previous year) |


 «The Baltic Course» Is Sold and Stays in Business!
