
Analytics, Economics, GDP, Latvia, Markets and Companies
International Internet Magazine. Baltic States news & analytics
Tuesday, 07.07.2026, 00:35
GDP of Latvia decreased by 2.1% in Q2
 Print version
According to seasonally adjusted data, the first quarter of 2010 over the second quarter of 2010 has increased by 0.8%, but over the second quarter of 2009 – dropped by 2.9%.*
|
Year |
Gross Domestic Product |
Gross Domestic Product per capita | |||
|
mln lats |
at constant prices, % of the corresponding quarter of the previous year |
in lats | |||
|
at current prices |
at constant prices of 2000 |
at current prices |
at constant prices of 2000 | ||
|
2009 |
13 083 |
6 828 |
82.0 |
5 802 |
3 028 |
|
1st quarter |
3 309 |
1 556 |
82.2 |
1 464 |
688 |
|
2nd quarter |
3 340 |
1 710 |
81.9 |
1 480 |
758 |
|
3rd quarter |
3 221 |
1 751 |
80.9 |
1 429 |
777 |
|
4th quarter |
3 213 |
1 811 |
83.2 |
1 428 |
805 |
|
2010 |
|
|
|
|
|
|
1st quarter |
2 853 |
1 463 |
94.0 |
1 270 |
651 |
|
2nd quarter |
3 143 |
1 675 |
97.9 |
1 402 |
747 |
Production approach
The increase in GDP was due to the rises in the following sectors: trade (share in GDP structure – 17.1%) - by 0.1%, transport and communications (12.2%) – by 2.5% and manufacturing (11.9%) – by 15.3%. Significant drop remained in construction (4.8%) – by 35.3%.
 |
|
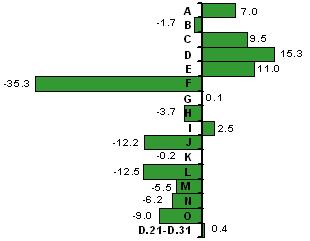
Changes of GDP in the 2nd quarter of 2010 by kind of economic activity (NACE rev. 1.1, at constant prices, % of the corresponding quarter of the previous year) |
A Agriculture, hunting and forestry;
B Fishing;
C Mining and quarrying;
D Manufacturing;
E Electricity, gas and water supply;
F construction;
G Wholesale, retail trade; repair of motor vehicles, motorcycles, personal, household goods;
H Hotels and restaurants;
I Transport and communications;
J Financial intermediation;
K Real estate, renting and business activities;
L Public administration and defence; compulsory social security;
M Education;
N Health and social work;
O Other community, social and personal service activities;
D.21-D.31 product taxes minus subsidies
 |
|
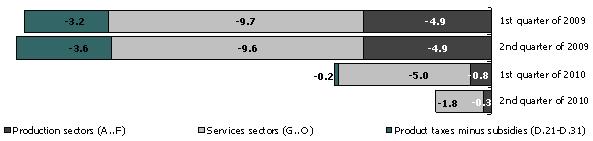
Impact of production approach components on changes of gross domestic product (at constant prices, percentage points) |
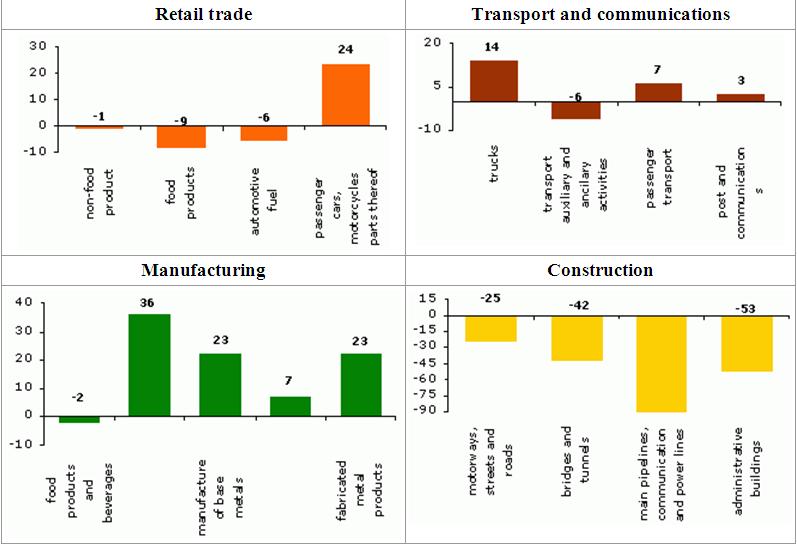 |
| Changes in the main activities in the 2nd quarter of 2010 (at constant prices, % of the corresponding quarter of the previous year) |
Expenditure approach
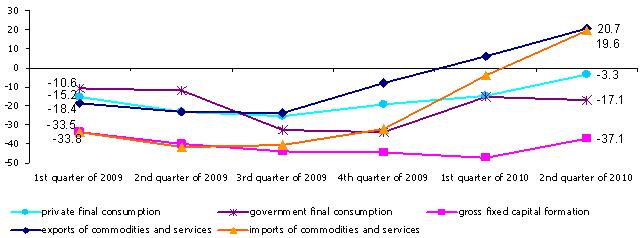
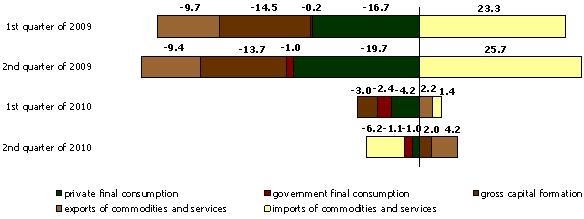
Compared to the 2nd quarter of 2009 (at current prices), in the 2nd quarter of 2010 final private consumption expenditure has decreased by 3.3%, government final consumption – by 17.1%, gross capital formation – by 37.1%. In its turn imports value increased by 19.6%, but exports value – by 20.7%.
 |
|
Increase of gross domestic product by main expenditure items, at current prices, % of the corresponding quarter of the previous year |
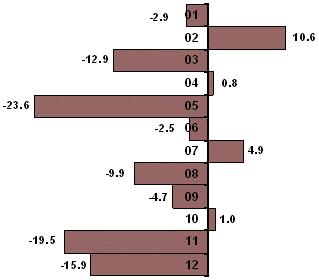
In final private consumption major expenditure was on housing maintenance which increased by 0.8%, on food which decreased by 2.9%, and on transport which grew by 4.9%.
 |
|
Changes of final private consumption expenditure by consumer groups in the 2nd quarter of 2010 (COICOP, at current prices, % of the corresponding quarter of the previous year) |
01 Food;
02 alcoholic beverages, tobacco;
03 clothing, foot wear;
04 housing, water, electricity, gas and other fuel;
05 furnishings, household equipment and routine households maintenance;
06 health;
07 transport;
08 communication;
09 recreation and culture;
10 Education;
11 Hotels and restaurants;
12 miscellaneous goods and services;
 |
|
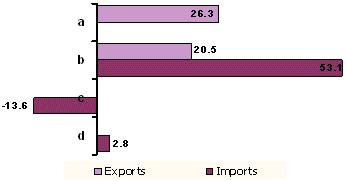
Changes of exports and imports in main commodities groups in the 2nd quarter of 2010 (at current prices, % of the corresponding quarter of the previous year) |
a wood and articles of wood;
b transport vehicles;
c mineral products;
d products of the chemical and allied industries;
 |
|
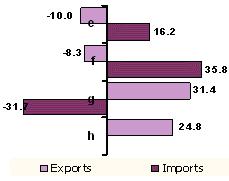
Changes of exports and imports in main services groups in the 2nd quarter of 2010 (data of the bank of Latvia, % of the corresponding quarter of the previous year) |
a recreational and business trips;
b freight;
c construction;
d passenger transportation
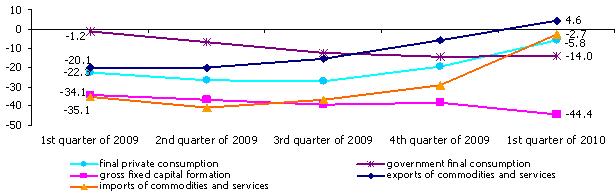
In the 2nd quarter of 2010 over the 2nd quarter of 2009 decrease of purchase volume in private final consumption at constant prices continued. Government final consumption expenditure decreased by 6.9%, but expenditure on gross capital formation – by 37.4%. Export of goods (72.2% of total exports) has increased by 22.6% and exports of services – reduced by 14.9%. However, volume of imports of goods (85.4 % of total imports) has increased by 17.9%, but volume of imports of services has decreased by 6.6%.
 |
|
Increase of gross domestic product by main expenditure items, at constant prices, % of the corresponding quarter of the previous year |
 |
|
Impact of use approach components on changes of gross domestic product (at constant prices, percentage points) |
 |
|
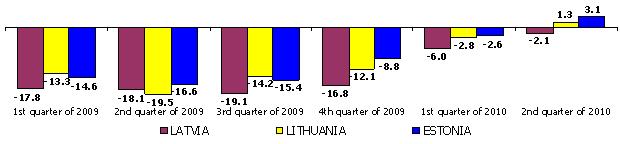
CHANGES OF GROSS DOMESTIC PRODUCT IN THE BALTIC COUNTRIES (at constant prices, % of the corresponding period of the previous year) |
* According to claculation methodology, seasonally adjusted data row changes by adding each new period. The new data row is available in the CSB data base.


 «The Baltic Course» Is Sold and Stays in Business!
