
Analytics, Industry, Latvia, Markets and Companies
International Internet Magazine. Baltic States news & analytics
Friday, 04.07.2025, 10:06
Industrial production output in Latvia increased by 18% in July y-o-y
 Print version
Compared to June 2010 industrial production volume in July 2010 grew by 2.3%, according to seasonally adjusted data at constant prices. Of which in manufacturing – by 2.7%, in mining and quarrying – by 0.8%, but in electricity and gas supply – by 0.6%.
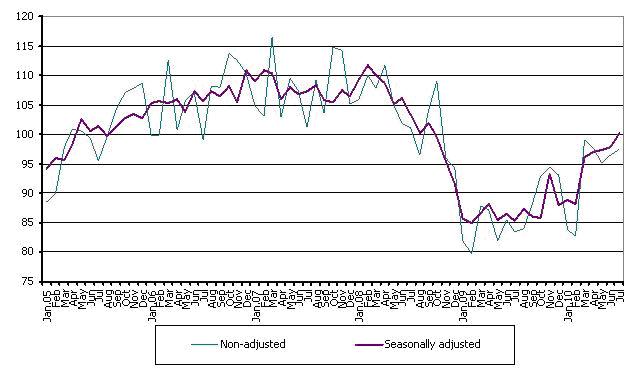
Industrial production volume index (2005=100)
Compared to July of previous year industrial production output in July 2010 at constant prices has increased by 18%, according to working day adjusted data. Of which in manufacturing – by 18.7%, in mining and quarrying – by 16.4%, but in electricity and gas supply – by 12.9%.
Most notable rise of industrial production output was recorded in the manufacture of basic pharmaceutical products and pharmaceutical preparations – by 89.9%, in the manufacture of electrical equipment – by 75.3% and in the manufacture of vehicles, trailers and semi-trailers – by 57.8%.
Changes in volume of industrial production in July 2010 (at constant prices)
|
|
I – VII 2010 as% over |
VII 2010 as % over | |
|
VI 2010 |
VII 2009 | ||
|
All production |
11.0 |
2.3 |
18.0 |
|
Mining and quarrying |
10.5 |
0.8 |
16.4 |
|
Manufacturing |
10.2 |
2.7 |
18.7 |
|
Manufacture of food products |
-2.5 |
0.0 |
1.5 |
|
Manufacture of textiles |
11.5 |
21.7 |
27.5 |
|
Manufacture of wearing apparel |
2.0 |
34.5 |
38.9 |
|
Manufacture of wood and cork articles, except furniture |
34.6 |
1.7 |
27.3 |
|
Manufacture of chemicals and chemical products |
30.8 |
-8.4 |
3.3 |
|
Manufacture of basic pharmaceutical products and pharmaceutical preparations |
-13.5 |
0.2 |
89.9 |
|
Manufacture of other non-metallic mineral products |
-7.4 |
8.5 |
24.9 |
|
Manufacture of basic metals |
16.7 |
-5.3 |
23.7 |
|
Manufacture of fabricated metal products, except machinery and equipment |
12.2 |
3.6 |
42.1 |
|
Manufacture of computer, electronic and optical products |
12.1 |
-2.1 |
24.8 |
|
Manufacture of electrical equipment |
23.6 |
-18.0 |
75.3 |
|
Manufacture of furniture |
-6.5 |
0.2 |
-5.8 |
|
Electricity and gas supply |
15.1 |
0.6 |
12.9 |
More information on seasonally adjusted, working day adjusted and non-adjusted industrial production volume indices is available in the data base of CSB: See here
_________
1 Data are compiled on economically active enterprises, which in industrial production employ 20 and more persons, or in which industrial turnover previous year exceeded LVL 300 thsd.
Industrial production volume in accordance with the Statistical Classification of Economic Activities NACE 2.rev. includes Mining and quarrying, Manufacturing and Electricity, gas, steam and air conditioning supply, except steam and air conditioning supply.
2 The influence of varying number of working days during the month is averted. This indicator was calculated only for comparison with corresponding period of previous year.
³ The influence of varying number of working days in the month and factors of seasonal repetition, i.e., seasonal fluctuations of goods produced in selected economic activities, has been eliminated. This indicator was calculated only for comparison with previous year.


 «The Baltic Course» Is Sold and Stays in Business!
