
Analytics, Lithuania, Tourism
International Internet Magazine. Baltic States news & analytics
Thursday, 18.06.2026, 09:58
Number of guests in Lithuanian accommodation establishments fell by 3.8% in Q1
 Print version
The majority of guests were from Russia – 19 thousand (in I quarter 2009, 18 thousand), Poland – 14.7 thousand (in I quarter 2009, 15.5 thousand), Belarus – 14.4 thousand (in I quarter 2009, 11.6 thousand), Latvia – 9.5 thousand (in I quarter 2009, 10.5 thousand), Germany – 6.9 thousand (in I quarter 2009, 8.7 thousand), Estonia – 4.9 thousand (in I quarter 2009, 4.7 thousand), the United Kingdom – 4.3 thousand (in I quarter 2009, 4.4 thousand).
Against I quarter 2009, the number of quests in the accommodation establishments of Druskininkai municipality increased by 23.1, Birštonas municipality – by 25.8%. The number of guests in the accommodation establishments of Neringa and Palanga municipalities decreased, respectively, by 20.6 and 19.3%. In I quarter 2010, the accommodation establishments of Druskininkai municipality accommodated 47.4 thous., Palanga municipality – 15.3, Birštonas municipality – 6, Neringa municipality – 1.1 thous. guests.
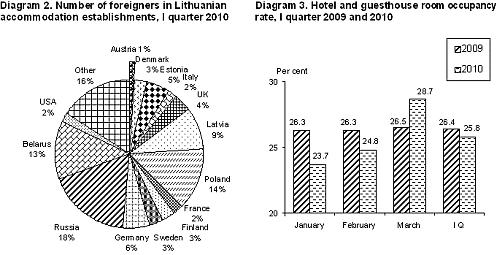
In I quarter 2010, against the same period of 2009, hotels and guesthouses accommodated by 2.2% less guests; the number of foreigners decreased by 3.9%. In I quarter 2010, the hotel and guesthouse room occupancy rate was 25.8% (in I quarter 2009, 26.4%).
In I quarter 2010, Vilnius hotels and guesthouses accommodated 77.4 thousand guests, or by 6.1% less than in the same period of 2009. The number of foreigners amounted to 57.8 thousand, or by 7% less than in the same period of 2009. In I quarter 2010, the occupancy rate of Vilnius hotel and guesthouse rooms was 32.6% (in I quarter 2009, 33.2%).
Table 1. Number of guests in accommodation establishments
|
|
Number of guests, 2010, thousand |
Compared to the previous year, growth, drop (-),% | ||||
|
total |
residents |
foreigners |
total |
residents |
foreigners | |
|
All accommodation establishments |
|
|
|
|
|
|
|
I Q |
232.3 |
125.2 |
107.1 |
-3.8 |
-4.2 |
-3.3 |
|
January |
70.6 |
36.8 |
33.8 |
-13.5 |
-14.9 |
-11.8 |
|
February |
73.7 |
42.3 |
31.4 |
-4.5 |
-4.3 |
-4.8 |
|
March |
88.0 |
46.1 |
41.9 |
6.4 |
6.6 |
6.3 |
|
of which: |
|
|
|
|
|
|
|
Hotels and guesthouses |
|
|
|
|
|
|
|
I Q |
183.5 |
90.0 |
93.5 |
-2.2 |
-0.4 |
-3.9 |
|
January |
55.9 |
26.4 |
29.5 |
-12.7 |
-13.4 |
-12.2 |
|
February |
58.2 |
30.7 |
27.5 |
-1.9 |
1.3 |
-5.3 |
|
March |
69.4 |
32.9 |
36.5 |
8.0 |
11.2 |
5.3 |
|
IV Q |
|
|
|
|
|
|
|
Rest establishments |
|
|
|
|
|
|
|
I Q |
4.9 |
4.8 |
0.1 |
-19.7 |
-19.3 |
-50.0 |
|
January |
1.6 |
1.6 |
0.0 |
-27.0 |
-26.6 |
-71.4 |
|
February |
1.7 |
1.7 |
0.0 |
-8.8 |
-8.6 |
-25.0 |
|
March |
1.6 |
1.5 |
0.1 |
-22.3 |
-21.8 |
-54.5 |
|
Health establishments |
|
|
|
|
|
|
|
I Q |
21.6 |
17.2 |
4.4 |
-3.8 |
-6.0 |
6.1 |
|
January |
6.8 |
4.9 |
1.9 |
-1.3 |
-3.9 |
6.1 |
|
February |
7.1 |
6.0 |
1.1 |
-9.8 |
-11.3 |
-0.6 |
|
March |
7.8 |
6.3 |
1.5 |
0.2 |
-2.2 |
11.7 |
Table 2. Distribution of hotels and guesthouses by stars
As of March 31
|
|
* * * * * |
* * * * |
* * * |
* * |
* |
Unclassified |
Total |
|
Establishments |
9 |
73 |
146 |
54 |
12 |
42 |
336 |
|
Number of rooms |
724 |
3774 |
4392 |
1961 |
289 |
561 |
11701 |
|
Number of beds |
1402 |
7078 |
8878 |
4038 |
708 |
1230 |
23334 |
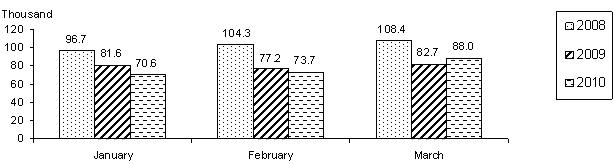 |
| Diagram 1. Number of guests in accommodation establishments, January–March 2008–2010 |


 «The Baltic Course» Is Sold and Stays in Business!
