
Analytics, Inflation, Lithuania
International Internet Magazine. Baltic States news & analytics
Thursday, 25.06.2026, 21:29
Average annual inflation in Lithuania made up 3.6% in January 2010
 Print version
 |
|
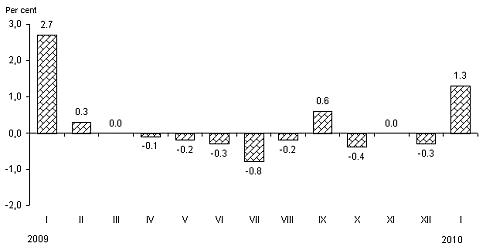
Fig 1. Monthly changes in prices for consumer goods and services as compared with the previous month |
Changes in prices for the group of goods and services related to housing, water, electricity, gas and other fuels were mainly influenced by a 33.3% price rise for electricity since 1 January 2010, 0.8% – hot water and centralized heating. Actual rentals for housing went down in price by 6.5%, liquefied gas for cooking – 1.7%, services related to the maintenance and repair of the dwelling – 0.8%.
The price change for clothing and footwear due to discounts was influenced by a 5% price drop for clothing, and 3.5% – footwear.
Regarding other goods and services which conditioned the overall change in consumer prices the following could be mentioned: a 2% price rise for mobile phone services, 1.7% – non-electrical household equipment, 0.5% – pharmaceuticals, 1.6% – household cleaning and maintenance products, as well as a 2.2% price drop package holidays, 0.9% – furniture, 6.2% – services of sanatoriums, 1.1% – electrical and non-electrical household equipment, 0.7% – video equipment and books each.
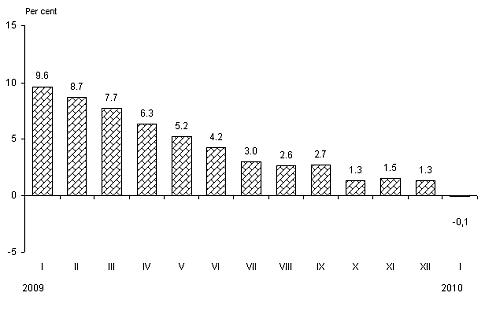
Prices for consumer goods and services showed an annual decrease (January 2010, against January 2009) of 0.1%. The decrease was influenced by a 5.1% price drop for food products and non-alcoholic beverages, 7.6% – clothing and footwear, 3.2% – housing, water, electricity, gas and other fuels, as well as a 19.6% price rise for alcoholic beverages and tobacco products, 4.4% – transport, 4% – health care goods and services.
Prices for consumer goods showed an annual decrease of 0.3%, while services went up in price by 0.2%.
 |
|
Fig. 2. Annual rates of change in prices for consumer goods and services against the respective month of the previous year |
In January 2010, average annual inflation made up 3.6%.
Table 1. Rates of change in prices for consumer goods and services, January 2010, %
|
COICOP divisions of consumer goods and services |
Relative share of consumption expenditure in total consumption expenditure (weights) |
Growth, drop (-) | ||
|
January 2010 against |
average annual | |||
|
December 2009 |
January 2009 |
January 2009–2010 | ||
|
Total CPI |
100.0 |
1.3 |
-0.1 |
3.6 |
|
Food products and non-alcoholic beverages |
25.7 |
1.0 |
-5.1 |
0.3 |
|
Alcoholic beverages and tobacco |
8.1 |
1.4 |
19.6 |
15.4 |
|
Clothing and footwear |
7.1 |
-4.5 |
-7.6 |
-8.4 |
|
Housing, water, electricity, gas and other fuels |
12.1 |
7.1 |
-3.2 |
9.3 |
|
Furnishings, household equipment and routine maintenance of the house |
6.4 |
-0.2 |
-2.2 |
1.3 |
|
Health care |
6.6 |
0.4 |
4.0 |
16.0 |
|
Transport |
11.4 |
2.2 |
4.4 |
-1.0 |
|
Communications |
4.0 |
1.2 |
-3.0 |
-1.4 |
|
Recreation and culture |
6.7 |
-0.4 |
-1.8 |
1.0 |
|
Education |
1.7 |
0.1 |
14.1 |
11.1 |
|
Hotels, cafes and restaurants |
5.0 |
0.1 |
-0.1 |
5.8 |
|
Miscellaneous goods and services |
5.2 |
1.3 |
1.8 |
9.0 |
Table 2. COICOP classes of consumer goods and services whose rates of change in prices had a decisive influence on the overall price change over the month (January 2010, against December 2009)
|
Influence, percentage points | |||
|
|
+ |
|
– |
|
Electricity |
0.862 |
Clothing |
-0.234 |
|
Fuels and lubricants |
0.282 |
Footwear |
-0.075 |
|
Vegetables and potatoes |
0.181 |
Meat and meat products |
-0.048 |
|
Tobacco products |
0.091 |
Actual rentals for housing |
-0.030 |
|
Telephone and telefax equipment and services |
0.046 |
Package holidays |
-0.026 |
|
Fruit and berries |
0.037 |
Passenger air transport |
-0.026 |
INFORMATION ON THE REVISION OF THE SYSTEM OF WEIGHTS
Statistics Lithuania annually revises the weighting system, used for the calculation of the Consumer Price Index (CPI), and updates it taking into consideration the changes in the structure of household consumption expenditure.
The new weighting system for the CPI (see Table 1) is based on the data of 2008 (reference period of weights) household budget survey on monetary consumption expenditure, industry, domestic and foreign trade, transport and services, energy statistics, as well as other institutions’ information. Available statistical information of 2009 is also used.
The price reference period is December 2009, i.e. in 2010 each month’s prices will be compared against this period’s prices. According to the Laspeyres formula, applied to the calculation of the CPI, data on weights and prices in the reference periods have to be consistent. Therefore, the statistical data on consumption expenditure in cash 2008 were updated up to December 2009 using respective CPIs, and a new weighting system for the calculation of the 2009 CPI was developed. For the calculation, the weights were used with the accuracy to the fifth decimal place.
The weighting system developed for the calculation of the 2010 CPI was conditioned by the changed structure of household consumption, which was due to the change in prices of consumer goods and services, increase in earnings and pensions. The most significant changes in the weighting system were as follows: the increase in the specific weight of consumption expenditure on transport products and services – by 0.9 percentage point (largest increase was recorded for fuel, passenger road transport, the largest decrease – acquisition of vehicles), alcoholic beverages and tobacco products and health care products and goods – 0.8% each, as well as a 0.9 decrease in specific weight of consumption expenditure on clothing and footwear and recreation and cultural goods.
The current weighting system covers 514 elementary aggregates of household consumption expenditure. These elementary aggregates are further specified using additional sources of information (information of other statistical areas and institutions) to the level of representative goods and services. In the CPI, elementary aggregates of household consumption goods and services are represented by 870 goods and services.
Inflation – the decrease in the purchasing power of a currency unit, which manifests itself with a long-term increase in the average general price level.
Annual inflation shows relative changes of the average price rate between the current month and the corresponding month of the previous year.
Average annual inflation shows relative changes of the average price rate between the average of the latest twelve months and the average of the corresponding previous twelve months.
COICOP – Classification of Individual Consumption by Purpose.


 «The Baltic Course» Is Sold and Stays in Business!
