
Analytics, Economics, Lithuania
International Internet Magazine. Baltic States news & analytics
Tuesday, 09.06.2026, 02:44
Prices for consumer goods and services grew by 0.8% in Lithuania
 Print version
The diagram presents monthly changes in prices for consumer goods and services as compared with the previous month.
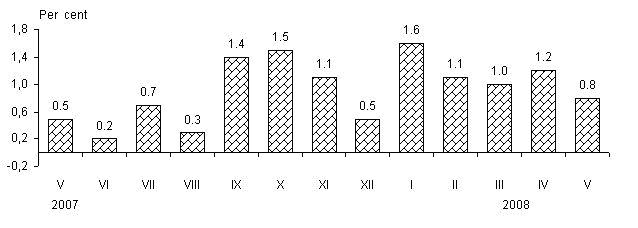
In May 2008, the most decisive impact on the total change in consumer prices was made by a 3.0% increase in prices for the transport group of goods and services, 0.8% – food products and non-alcoholic beverages, 0.6% – housing, water, electricity, gas and other fuels, 1.3% – health care group of goods and services, as well as by a 0.4% price drop for recreational and cultural goods and services. The impact on the general consumer price change depends not only on the price change for a product, service, or a group thereof, but also on the specific weight of this expenditure in the total consumption expenditure.
Prices for each consumer goods and services in May 2008 as compared with April rose by 0.8%.
Changes in prices for the group of transport goods and services were mainly influenced by a 4.9% price rise for petrol, 7.8% – diesel fuel, 2.1% – passenger road transport services, 2.2% – personal transport equipment technical maintenance and repair services, 2.4% – liquefied gas for cars.
Changes in prices for the group of goods and services related to housing, water, electricity, gas and other fuels were mainly influenced by a 3.4% increase in actual rentals for housing, 1.1% price rise for materials for the maintenance and repair of the dwelling, 3.7% – waste disposal, 0.6% – services for the maintenance and repair of the dwelling. Liquefied gas for cooking went down in price by 0.2%.
Changes in prices for the group of health care goods and services were influenced by a 0.9% price rise for pharmaceuticals, 6.0% – sanatorium, 2.1 – odontologists’, 1.9% – medical services.
In May 2008, annual inflation (May 2008 against May 2007) made up 12.0%. The annual inflation rate was mostly influenced by a 18.1% price rise for food products and non-alcoholic beverages, 18.6% – housing, water, electricity, gas and other fuels, 15.6% – transport group of goods and services, as well as by a 3.4% price drop for clothing and footwear.
Consumer goods showed an annual increase of 11.9, while services – of 12.5%.
In May 2008, average annual inflation made up 8.5%.
Price changes of key consumer goods and services groups in May 2008, %
|
Commodity and service groups |
Specific weight in total consumption expenditure |
Growth, drop (-) | ||||
|
May 2008 against |
average annual | |||||
|
April 2008 |
2007 |
2007–2008 05 | ||||
|
December |
May | |||||
|
Total CPI |
100,0 |
0,8 |
5,9 |
12,0 |
8,5 | |
|
Food products and non-alcoholic beverages |
25,7 |
0,8 |
7,5 |
18,1 |
14,7 | |
|
Alcoholic drinks and tobacco products |
6,6 |
1,0 |
13,4 |
18,2 |
9,9 | |
|
Clothing and footwear |
8,2 |
0,0 |
-4,1 |
-3,4 |
-4,7 | |
|
Housing, water, electricity, gas and other fuels |
12,4 |
0,6 |
7,4 |
18,6 |
14,6 | |
|
Furnishings, household equipment and routine maintenance |
6,4 |
0,3 |
2,9 |
4,9 |
3,1 | |
|
Health care |
5,3 |
1,3 |
6,3 |
11,4 |
8,8 | |
|
Transport |
11,5 |
3,0 |
10,0 |
15,6 |
9,4 | |
|
Communications |
4,1 |
0,0 |
-0,3 |
-4,1 |
-6,2 | |
|
Recreation and culture |
7,6 |
-0,4 |
1,5 |
1,4 |
0,4 | |
|
Education |
1,5 |
0,1 |
2,0 |
8,8 |
7,6 | |
|
Hotels, cafes and restaurants |
5,7 |
0,6 |
9,2 |
16,8 |
12,6 | |
|
Miscellaneous goods and services |
5,0 |
-0,2 |
4,0 |
9,1 |
7,8 | |


 «The Baltic Course» Is Sold and Stays in Business!
