
Analytics, Export, Lithuania, Statistics
International Internet Magazine. Baltic States news & analytics
Friday, 01.11.2024, 00:50
Lithuania: International trade in services in Q2 2020
 Print version
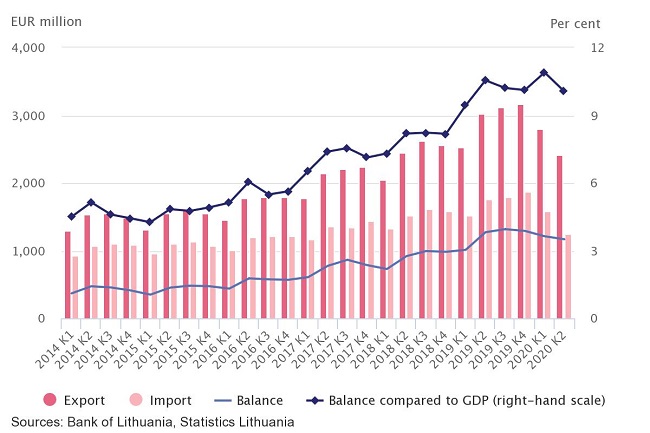
The surplus on the balance of services amounted to
EUR 1.2 bn or 10.1% of GDP, an annual decrease of 8.2%.
On a y-o-y basis, the highest decrease was recorded in
exports and imports of travel services (87.9% and 89.1% respectively).
Transport services comprised the main bulk of export and
import of services (64% and 55.9% respectively). In II quarter 2020,
the largest surplus (EUR 624.7 mln) was recorded on the balance of
road transport services, while the largest deficit (EUR 15.2 mln) –
on the balance of postal and courier services.
Exports of services to the EU Member States
(27 countries) accounted for 68.1% of total exports of services, a y-o-y
decrease of 17.6%. Imports of services from the EU Member States accounted for
65.1% of total imports of services, a y-o-y decrease of 25.3%.
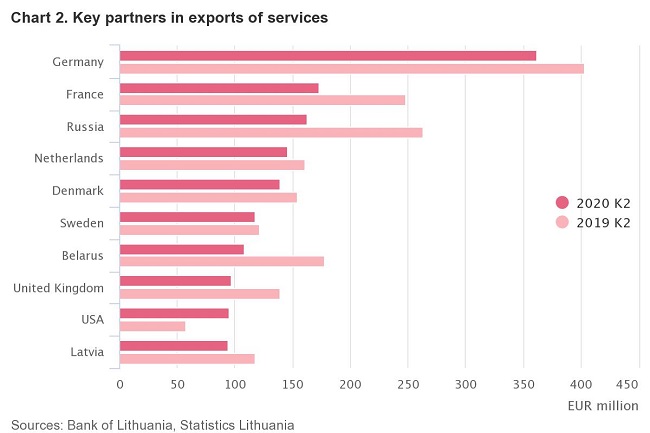
Germany was Lithuania’s major partner in exports of services
in II quarter 2020. Over the year, the volume of exports to this
country decreased by 10.2% (see Chart 2). Transport (79.1%) and other
business (6.5%) services comprised the largest share of total exports of
services to Germany.
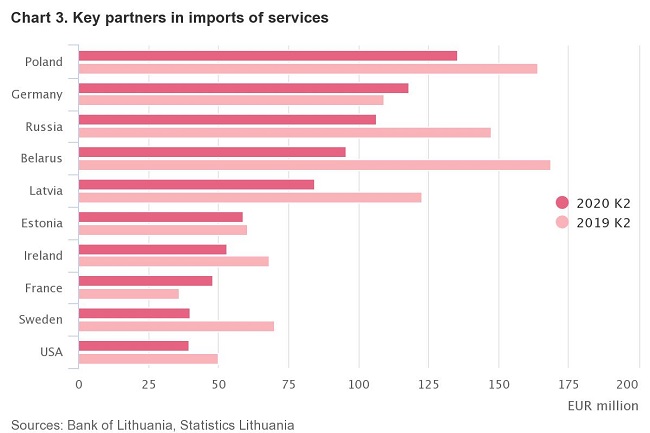
Lithuania’s main partner in imports of services was Poland
(see Chart 3). Over the year, the volume of imports from this country
decreased by 17.5%. The largest share of total imports of services from
Poland consisted of transport and other business services (83.1% and 7%
respectively).
Structure and changes of exports and imports of services,
II quarter 2020
|
|
Exports |
Imports |
||||
|
EUR
million |
share,
% |
change,
compared to II quarter 2019, % |
EUR
million |
share,
% |
change,
compared to II quarter 2019, % |
|
|
Total
services |
2,408.1 |
100.0 |
–20.6 |
1,240.5 |
100.0 |
–29.5 |
|
Technical
maintenance and repair services |
48.9 |
2.0 |
–49.6 |
29.4 |
2.4 |
–44.0 |
|
Transport
services |
1,540.7 |
64.0 |
–13.6 |
692.9 |
55.9 |
–18.8 |
|
Carriage
of passengers |
15.4 |
0.6 |
–62.6 |
5.3 |
0.4 |
–89.3 |
|
Freight |
967.3 |
40.2 |
–5.8 |
374.2 |
30.2 |
–13.6 |
|
Other
transport services |
558.0 |
23.2 |
–22.1 |
313.4 |
25.3 |
–15.7 |
|
Travel |
46.7 |
1.9 |
–87.9 |
38.3 |
3.1 |
–89.1 |
|
Construction |
83.4 |
3.5 |
–11.1 |
18.5 |
1.5 |
–62.1 |
|
Financial
services |
50.3 |
2.1 |
30.7 |
29.4 |
2.4 |
–26.2 |
|
Telecommunications,
computer and information services |
242.9 |
10.1 |
46.9 |
116.1 |
9.3 |
38.3 |
|
Telecommunications
services |
19.8 |
0.8 |
8.1 |
22.3 |
1.8 |
1.7 |
|
Computer
services |
214.7 |
8.9 |
51.8 |
86.0 |
6.9 |
57.1 |
|
Information
services |
8.4 |
0.4 |
49.6 |
7.8 |
0.6 |
7.7 |
|
Other
business services |
296.8 |
12.3 |
–13.6 |
261.0 |
21.0 |
–5.6 |
|
Research
and technological development services |
12.5 |
0.5 |
–15.2 |
3.1 |
0.2 |
–20.5 |
|
Professional
and advisory management services |
88.0 |
3.7 |
10.5 |
75.8 |
6.1 |
42.1 |
|
Technical,
trade-related and other business services |
196.3 |
8.1 |
–21.2 |
182.1 |
14.7 |
–16.9 |
|
Other
undistributed services |
98.4 |
4.1 |
–20.0 |
54.9 |
4.4 |
1.3 |
Sources:
Bank of Lithuania and Statistics Lithuania.
- 29.12.2020 В Латвии вводят комендантский час, ЧС продлена до 7 февраля
- 29.12.2020 Latvia to impose curfew, state of emergency to be extended until February 7
- 29.12.2020 Linde Gas открывает завод в Кедайняйской СЭЗ
- 29.12.2020 Lithuanian president signs 2021 budget bill into law
- 29.12.2020 Президент Литвы утвердил бюджет 2021 года
- 28.12.2020
- 23.12.2020 В Литве учреждены еще две белорусских компании
- 23.12.2020 Lidl Lithuania to destroy Salmonella-contaminated eggs from Ukraine
- 23.12.2020 LTG Infra gets green light to build Rail Baltica section from Kaunas to Latvian border
- 22.12.2020 LTG Infra дает зеленый свет строительству Rail Baltica от Каунаса до границы с Латвией


 «The Baltic Course» Is Sold and Stays in Business!
