
Analytics, Industry, Lithuania, Markets and Companies
International Internet Magazine. Baltic States news & analytics
Sunday, 21.06.2026, 09:56
Prices for industrial production sold in Lithuania grew by 2.2% in June 2009
 Print version
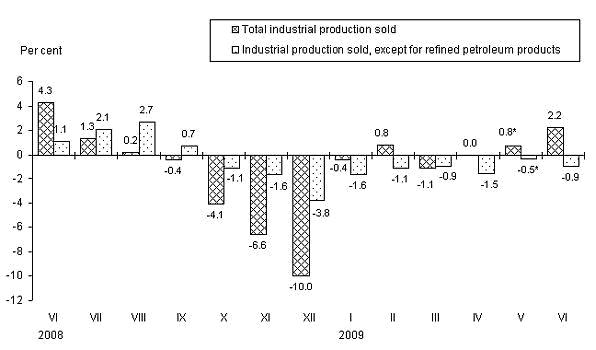 |
| Figure 1. Changes in prices for industrial production sold over a month |
* Revised data.
In June 2009, against May, the overall price change was mostly influenced by a 14.6% price rise for refined petroleum products, 15.8% – crude petroleum, 1.0% – metallic products, except for machinery and equipment, as well as by a 3.2% price drop for chemicals and chemical products, 4.3% – steam and air conditioning supply, 5.1% – wearing apparel.
Prices for products sold on the domestic market over a month grew by 0.1%. It was mostly influenced by a 9.7% increase in prices for refined petroleum products, 1.6% – metallic products, except for machinery and equipment, 1.4% – wood and wood products, except for furniture, 6.7% – electrical equipment, as well as by a 4.3% decrease in prices for steam and air conditioning supply, 7.6% – chemicals and chemical products, 0.5% – food products, 2.4% – furniture. In the group of food products, the most noticeable price drop was observed for grain mill products – 2.8%, bread and fresh pastry goods – 2.3%, milk products (excluding ice-cream) – 2.0%, poultry – 1.8%, other meat – 1.2%; while ice-cream went up in price by 8.2%, sugar – 5.7%, condiments and seasoning – 3.8%. Refined petroleum products excluded, prices for products sold on the domestic market decreased by 0.9%.
Prices for exported products in June 2009, against May, increased by 4.4%. It was mostly influenced by a 16.1% price rise for refined petroleum products, 16.3% – crude petroleum, 9.5% – beverages, as well as by a 5.8% price drop for wearing apparel, 1.8% – chemicals and chemical products, 5.7% – machinery and equipment n.e.c. Refined petroleum products industry excluded, prices of exported products decreased by 1.0%.
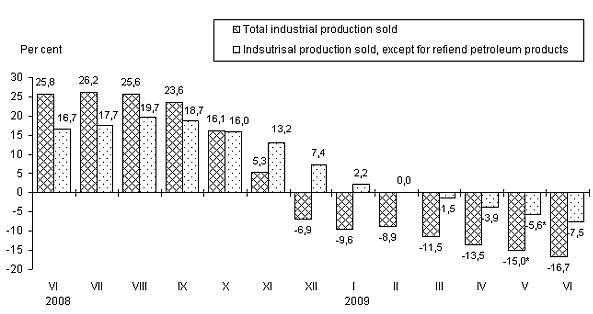
Over a year (June 2009, against June 2008), prices for total industrial production sold decreased by 16.7%.
 |
|
Figure 2. Changes in prices for industrial production sold, against the respective month of the previous year |
* Revised data.
Changes in prices for industrial production sold, June 2009, %
|
Industrial production sold by economic activity |
Relative share in industrial production |
June 2009 against | ||
|
May 2009 |
2008 | |||
|
December |
June | |||
|
Total industrial production |
100.0 |
2.2 |
2.3 |
-16.7 |
|
Mining and quarrying |
1.1 |
3.4 |
14.2 |
-25.5 |
|
Manufacturing |
81.1 |
2.9 |
3.4 |
-20.7 |
|
Manufacture of refined petroleum products |
15.6 |
14.6 |
49.2 |
-38.9 |
|
Electricity, gas, steam and air conditioning supply |
16.1 |
-1.1 |
-4.3 |
9.6 |
|
Water supply; sewerage, waste management and remediation activities |
1.7 |
0.0 |
3.8 |
-2.0 |
|
|
|
|
|
|
|
Total industrial production, refined petroleum products excluded |
84.4 |
-0.9 |
-6.3 |
-7.5 |
|
Manufacturing production, refined petroleum products excluded |
65.5 |
-1.0 |
-7.4 |
-11.0 |
|
|
|
|
|
|
|
Industrial production sold on the domestic market |
100.0 |
0.1 |
-2.6 |
-7.5 |
|
Mining and quarrying |
1.3 |
0.8 |
5.6 |
-11.6 |
|
Manufacturing |
67.2 |
0.7 |
-2.0 |
-13.9 |
|
Manufacture of refined petroleum products |
8.2 |
9.7 |
23.3 |
-40.7 |
|
Electricity, gas, steam and air conditioning supply |
30.1 |
-1.1 |
-4.4 |
9.7 |
|
Water supply; sewerage, waste management and remediation activities |
1.4 |
0.3 |
3.3 |
8.3 |
|
|
|
|
|
|
|
Industrial production sold on the domestic market, refined petroleum products excluded |
91.8 |
-0.9 |
-4.9 |
-1.2 |
|
Manufacturing production, refined petroleum products excluded |
59.0 |
-0.8 |
-5.5 |
-6.2 |
|
|
|
|
|
|
|
Exported industrial production |
100.0 |
4.4 |
7.7 |
-25.2 |
|
Mining and quarrying |
0.8 |
7.6 |
31.0 |
-38.5 |
|
Manufacturing |
96.5 |
4.5 |
7.6 |
-25.4 |
|
Manufacture of refined petroleum products |
23.6 |
16.1 |
59.1 |
-38.6 |
|
Electricity, gas, steam and air conditioning supply |
0.8 |
0.0 |
0.0 |
0.0 |
|
Water supply; sewerage, waste management and remediation activities |
1.9 |
-0.2 |
4.3 |
-9.8 |
|
|
|
|
|
|
|
Exported industrial production, refined petroleum products excluded |
76.4 |
-1.0 |
-8.3 |
-15.5 |
|
Manufacturing production, refined petroleum products excluded |
72.9 |
-1.2 |
-9.1 |
-15.2 |


 «The Baltic Course» Is Sold and Stays in Business!
