
Analytics, Industry, Latvia, Statistics
International Internet Magazine. Baltic States news & analytics
Friday, 26.06.2026, 04:48
Latvia: In October, industrial production output rose by 3%
 Print version
Compared to the corresponding month of the previous year, output rise (of 1.1%) was recorded in the manufacturing sector having the largest share in industrial production – manufacture of wood and of products of wood and cork. Upturn was also registered in manufacture of fabricated metal products, except machinery and equipment (of 15.8 %) and manufacture of non-metallic mineral products (5.2%).
Decline, in turn, was recorded in manufacture of food products (of 1.8%), repair and installation of machinery and equipment (14.4%), as well as manufacture of computer, electronic and optical products (2.5%).
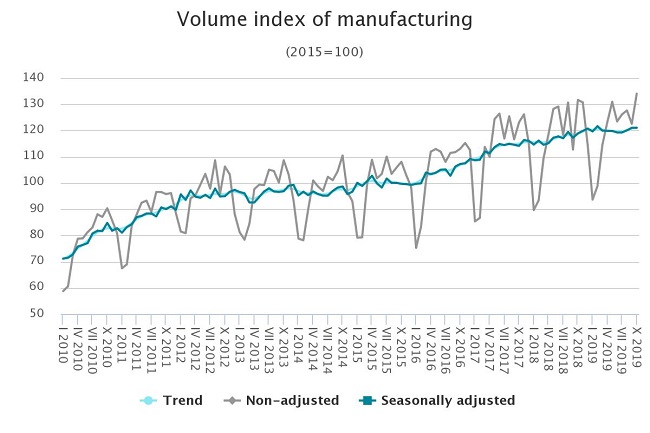
Compared to September 2019, in October 2019 industrial production output fell by 2.3%, (according to seasonally adjusted data at constant prices), of which in electricity and gas supply by 12.7%, whereas in mining and quarrying there was an increase of 0.6%. Manufacturing output did not change.
Industrial
production output changes
(as per cent, at constant
prices)
|
|
JAN–OCT 2019 compared
to JAN–OCT 2018 (calendar
adjusted) |
OCT
2019, compared to |
|
|
SEP 2019
(seasonally adjusted) |
OCT 2018 (calendar
adjusted) |
||
|
Total industrial production |
1.3 |
-2.3 |
3.0 |
|
Mining and quarrying |
-3.9 |
0.6 |
-19.6 |
|
Manufacturing |
2.6 |
0.0 |
1.8 |
|
Manufacture of food products |
-1.0 |
0.3 |
-1.8 |
|
Manufacture of beverages |
-1.0 |
3.9 |
7.1 |
|
Manufacture of textiles |
3.9 |
-3.2 |
-6.0 |
|
Manufacture of wearing apparel |
-6.7 |
3.3 |
-3.0 |
|
Manufacture of wood and of products of wood and
cork, except furniture |
0.4 |
1.7 |
1.1 |
|
Manufacture of paper and paper products |
0.2 |
-8.8 |
2.3 |
|
Printing and reproduction of recorded media |
7.9 |
2.4 |
8.8 |
|
Manufacture of chemicals and chemical products |
-4.7 |
-2.8 |
-5.4 |
|
Manufacture of other non-metallic mineral products |
-2.5 |
6.2 |
5.2 |
|
Manufacture of fabricated metal products, except
machinery and equipment |
15.2 |
1.1 |
15.8 |
|
Manufacture of computer, electronic and optical
products |
9.6 |
-7.3 |
-2.5 |
|
Manufacture of electrical equipment |
19.2 |
-12.7 |
-7.5 |
|
Manufacture of machinery and equipment |
1.6 |
1.4 |
-4.5 |
|
Manufacture of motor vehicles, trailers and
semi-trailers |
-1.8 |
-2.3 |
-17.5 |
|
Manufacture of furniture |
-5.6 |
6.2 |
1.1 |
|
Repair and installation of machinery and equipment* |
9.9 |
-16.1 |
-14.4 |
|
Electricity and gas supply |
-5.2 |
-12.7 |
11.9 |
* Repair and maintenance of ships and boats, repair of
fabricated metal products, machinery and equipment, installation of
industrial machinery and equipment.
Manufacturing turnover2
Compared to October 2018, in October 2019 manufacturing turnover increased by 1.2% (according to calendar adjusted data at current prices). Turnover on the domestic market went up by 9.1% while in export fell by 2.8% (drop of 6.1% in euro area and rise of 0.2% in non-euro area).
Compared to September 2019, in October 2019 manufacturing turnover rose by 0.9% (according to seasonally adjusted data). Turnover on the domestic market rose by 7.6% whereas in export went down by 2.6% (of which decline of 0.1% in euro area and of 4.6% in non-euro area).


 «The Baltic Course» Is Sold and Stays in Business!
