
Analytics, Employment, Latvia, Statistics
International Internet Magazine. Baltic States news & analytics
Wednesday, 01.04.2026, 15:53
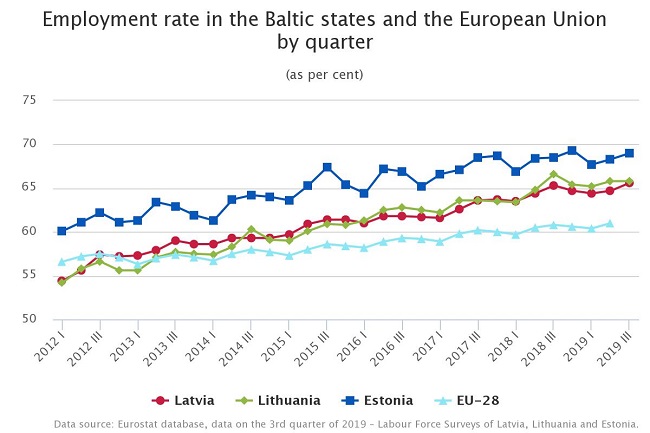
Employed population of Latvia constituted 65.6 % in Q3 2019
 Print version
Compared to the previous quarter, employment rate grew by 0.9 percentage points and number of employed persons by 12.2 thousand. In the 3rd quarter, seasonal employment increase was recorded in construction, accommodation and catering, as well as agriculture, forestry and fishing.
Nevertheless since the 4th quarter of 2012 Latvian employment rate exceeds the European Union (EU) average (in the 2nd quarter of 2019 it constituted 61.0%), in the 3rd quarter of 2019 it was the lowest among the Baltic states – employment rate in Estonia constituted 69.0% and in Lithuania 65.8%.
In the 3rd quarter of 2019, employment rate among young people (aged 15–24) comprised 33.0%, which is 3.2 percentage points lower than in the corresponding period of the previous year. Out of all young people, 56.4 thousand were employed.
In the 3rd quarter of the year, persons employed in the main job worked on average 38.6 hours per week, which is 0.2 hours fewer than a year ago.
Over the year, the share of employees receiving less than EUR 450 monthly (after taxes) comprised 23.0% (a drop of 5.9 percentage points), the proportion of employees receiving minimum monthly wage1 or less constituted 100.6 thousand or 12.4% (a reduction of 2.9 percentage points). The highest share of people receiving lowest wages was still recorded in Latgale where 22.1% of the employees received minimum wage or less. The share of employees receiving monthly net wages and salaries comprising EUR 450–700.00 grew by 0.8 percentage points (34.3% in the 3rd quarter), and that of employees receiving EUR 700–1400 monthly grew by 4.7 percentage points (31.8% in the 3rd quarter). The proportion of employees receiving more than EUR 1400 monthly increased by 1.7 percentage points. In its turn, wage or salary of 2.4% of employees was not calculated or paid, while 2.6% did not indicate the size of earnings thereof.
Employees
by monthly net wages and salaries in the main job
(as %)
|
|
Q3 2018 |
Q2 2019 |
Q3 2019 |
|
Employees |
100.0 |
100.0 |
100.0 |
|
up to EUR 450.00 |
28.9 |
27.7 |
23.0 |
|
employees receiving minimum monthly wage or less |
15.3 |
15.6 |
12.4 |
|
EUR 450.01–700.00 |
33.5 |
31.5 |
34.3 |
|
EUR 700.01-1400.00 |
27.1 |
30.2 |
31.8 |
|
EUR 1400.01 and more |
4.2 |
5.3 |
5.9 |
|
was not calculated or paid |
3.3 |
2.9 |
2.4 |
|
not specified |
3.0 |
2.4 |
2.6 |
In the 3rd quarter of 2019, Labour Force Survey questions about economic activity were asked to 7.1 thousand people aged 15–74 living in 4.0 thousand households.


 «The Baltic Course» Is Sold and Stays in Business!
