
Analytics, Foreign trade , Latvia, Statistics
International Internet Magazine. Baltic States news & analytics
Saturday, 20.06.2026, 02:55
In September value of goods exported from Latvia was 2.5 % larger than a year ago
 Print version
In
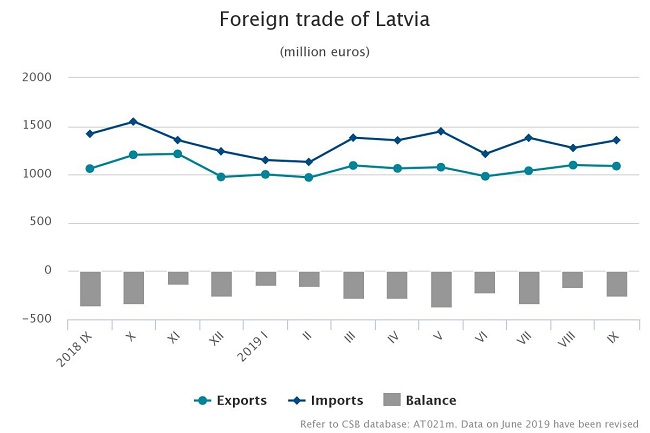
September, Latvia exported goods in the amount of EUR 1.09 bn, but
imported in the amount of EUR 1.36 bn. Compared to
September 2018, foreign trade balance has improved as exports in total
foreign trade amount increased from 42.7% to 44.5%.
Over the
nine months of this year, the foreign trade turnover of Latvia at current
prices reached EUR 21.1 bn – EUR 95.1 mln or 0.5% more than
in the corresponding period of 2018. The exports value constituted
EUR 9.41 bn (an increase of EUR 56.6 mln or 0.6%), whereas
the imports value – EUR 11.69 bn (an upturn of EUR 38.5 mln
or 0.3%).
Calendar
and seasonally adjusted data show that, compared to September 2018, in
September 2019 the exports value at current prices went down by 1.5% and
the imports value by 10.6%, whereas, compared to the previous month, the
exports value decreased by 3.9%, but the imports value increased by 4.2%.
Main
changes in exports in September 2019, compared to September 2018:
- exports of vegetable products p by EUR 25.6 mln or 35.8%,
- exports of products of the chemical and allied
industries up
by EUR 16.2 mln or 22%,
- exports
of prepared foodstuffs up by EUR 15 mln or 14.5%,
- exports
of machinery and mechanical appliances; electrical equipment down by
EUR 21.6 mln or 11%,
- exports
of wood and articles of wood down by EUR 18 mln or 10%.
Main
changes in imports in September 2019, compared to September 2018:
- imports of vehicles and associated transport equipment up by EUR 21.8 mln
or 13.5%,
- imports of prepared foodstuffs up by EUR 17.4 mln or 15.6%,
- imports of mineral products down by EUR 82.6 mln or 37%,
- imports of machinery and mechanical appliances;
electrical equipment down by EUR 32.9 mln or 11.3%,
- imports
of basic metals and articles of basic metals down by
EUR 13.7 mln or 12.5%.
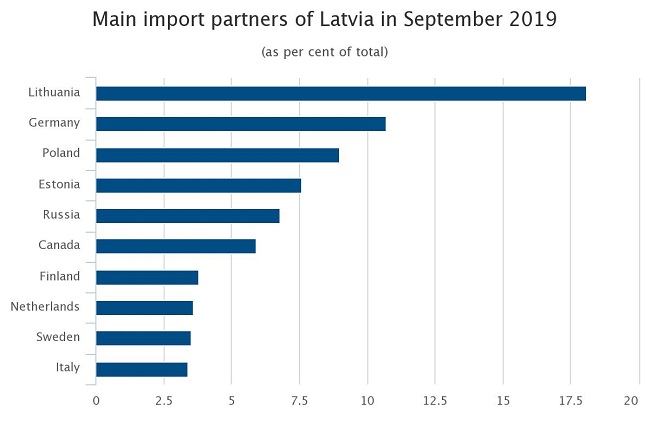
In September, the main export partners of Latvia in trade with EU countries were Lithuania (16.9% of total exports), Estonia (11.3%), Germany (6.8 %) and Sweden (6.4 %), whereas the main import partners were Lithuania (18.1% of total imports), Germany (10.7%), Poland (9%) and Estonia (7.6%). The main partner in trade with third countries was Russia, share of which in total Latvian exports in September accounted for 10.5%, but in imports – for 6.8%.

In September 2019, compared to September 2018,
share of the European Union countries remained the same in total exports value
– (70.3%) but in imports value – grew by 6.7 percentage points. Rise in share
of CIS countries comprised 1.8 percentage points in exports and drop of
5.3 percentage points in imports.
Foreign
trade of Latvia by country group in September 2019
(at current prices)
|
|
Exports |
Imports |
||||
|
|
million EUR |
%
of total |
changes
as %, compared to September 2018 |
million EUR |
%
of total |
changes
as %, compared to September 2018 |
|
Total |
1,087.3 |
100 |
2.5 |
1,356.0 |
100 |
-4.6 |
|
European Union countries |
764.2 |
70.3 |
2.4 |
1,022.2 |
75.4 |
4.6 |
|
euro area countries |
531.9 |
48.9 |
5.4 |
748.0 |
55.2 |
3.4 |
|
CIS countries |
158.2 |
14.5 |
17.4 |
133.8 |
9.9 |
-38.3 |
|
other countries |
164.9 |
15.2 |
-8.3 |
200.0 |
14.7 |
-12.2 |
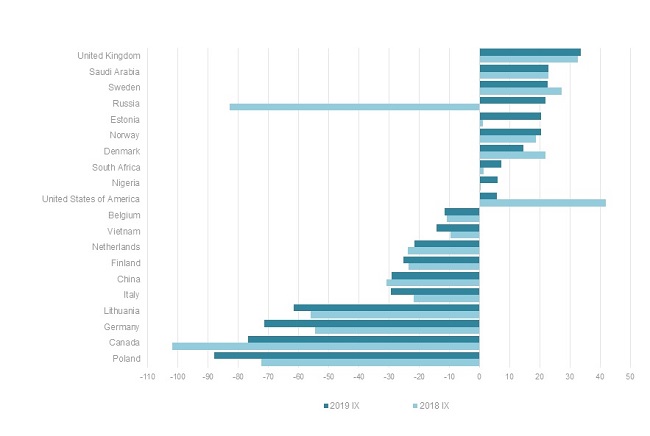
In September 2019 foreign trade balance of Latvia was
positive with 124 partner countries, as exports value of goods exceeded imports
value of goods. It was negative in trade with 42 countries.
Balance of foreign trade of Latvia
(difference between value of goods exports and imports, million euros)
The rise in the exports of cereals in September 2019,
as compared to September 2018, was facilitated by an increase in the
exports of wheat and meslin by EUR 18.5 mln or 59.3%. But exports of
machinery and mechanical appliances reduced as exports of turbojets,
turbopropellers and other gas turbines dropped by EUR 40.4 mln or
99.2%.
Main
commodities in exports of Latvia in September 2019
(at current prices)
|
|
Thousand EUR |
As %
of total |
Changes
as %, compared to |
||
|
September 2018 |
August 2019 |
average
of previous 12 months |
|||
|
Total |
1 087 291 |
100 |
2.5 |
-0.9 |
2.1 |
|
162 581 |
15.0 |
-10.0 |
-8.7 |
-14.8 |
|
|
112 616 |
10.4 |
11.0 |
0.7 |
1.3 |
|
|
65 801 |
6.1 |
5.2 |
12.8 |
23.8 |
|
|
61 349 |
5.6 |
-34.8 |
-1.7 |
-11.4 |
|
|
59 390 |
5.5 |
28.4 |
-25.8 |
62.7 |
|
|
vehicles
other than railway or tramway rolling stock, and parts and accessories
thereof |
58 238 |
5.4 |
11.5 |
14.5 |
-2.2 |
|
42 675 |
3.9 |
27.2 |
8.3 |
18.4 |
|
|
mineral
fuels, mineral oils and products of their distillation |
42 481 |
3.9 |
-22.0 |
-4.8 |
-20.9 |
|
39 086 |
3.6 |
13.2 |
-9.2 |
-1.6 |
|
|
furniture,
other furnishing articles; prefabricated buildings |
33 952 |
3.1 |
14.2 |
7.2 |
12.6 |
Rise of imports of aircraft, spacecraft, and parts thereof
in September 2019, compared to September 2018, was affected by
purchase of ground flying trainers and parts thereof of EUR 10.3 mln.
In its turn, reduction of imports of mineral fuels, mineral oils and products
of their distillation was mostly influenced by decrease of imports of natural
gas in the gaseous state by EUR 65.7 mln or 67.5%.
Main
commodities in imports of Latvia in September 2019
(at current prices)
|
|
Thousand EUR |
As %
of total |
Changes
as %, compared to |
||
|
September 2018 |
August 2019 |
average
of previous 12 months |
|||
|
Total |
1 356 026 |
100 |
-4.6 |
6.3 |
2.4 |
|
138 600 |
10.2 |
-5.4 |
5.2 |
1.9 |
|
|
mineral fuels, mineral oils and products of their
distillation |
134 620 |
9.9 |
-37.8 |
-10.8 |
1.7 |
|
119 959 |
8.8 |
-17.2 |
13.4 |
-9.9 |
|
|
vehicles other than railway or tramway rolling stock, and
parts and accessories thereof |
100 746 |
7.4 |
5.9 |
8.3 |
-10.1 |
|
77 396 |
5.7 |
17.2 |
26.9 times |
68.7 |
|
|
60 503 |
4.5 |
13.9 |
13.2 |
26.4 |
|
|
54 325 |
4.0 |
6.6 |
4.4 |
1.7 |
|
|
49 445 |
3.6 |
9.2 |
9.5 |
-6.2 |
|
|
45 410 |
3.3 |
-5.0 |
-1.8 |
-7.1 |
|
|
39 893 |
2.9 |
-31.7 |
11.8 |
-21.0 |
|


 «The Baltic Course» Is Sold and Stays in Business!
