
Analytics, Foreign trade , Latvia, Statistics
International Internet Magazine. Baltic States news & analytics
Monday, 16.03.2026, 12:26
In June, Latvian foreign trade turnover was 10.3% lower than year before
 Print version
 In June, Latvia exported goods in
the amount of EUR 982.9 bn and imported in the amount of EUR 1.21 bn.
During the
first half of the year, Latvian foreign trade turnover at current prices
reached EUR 13.83 bn – EUR 336.1 mln or 2.5% more than in
the corresponding period of 2018. Exports value constituted EUR 6.18 bn
(rise of EUR 20.6 mln or 0.3%), while imports value
EUR 7.65 bn (increase of EUR 315.5 mln or 4.3%).
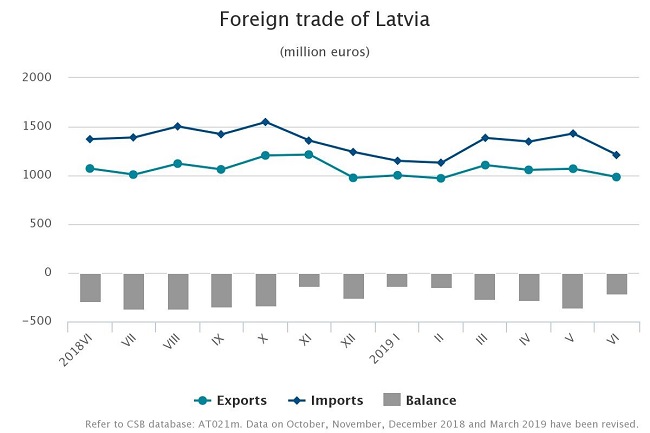
Calendar and seasonally adjusted data show that, compared to June 2018, in June 2019 exports value at current prices went down by 3.4% and imports value by 7.2%, whereas, compared to the previous month, exports value increased by 0.1% while imports value fell by 12.2%.
Main
changes in exports in June 2019, compared to June 2018:
- exports of prepared foodstuffs
up by EUR 7.3 mln or 8.8%,
- exports of machinery and
mechanical appliances; electrical equipment down by EUR 40.1 mln
or 20%,
- exports of basic metals and
articles of basic metals down by EUR 20.8 mln or 20.4%,
- exports of wood and articles of
wood down by EUR 17.5 mln or 9%,
- exports of vegetable products
down by EUR 6.2 mln or 9%;
Main
changes in imports in June 2019, compared to June 2018:
- imports of mineral products
down by EUR 17.8 mln or 13.5%.
- imports of machinery and
mechanical appliances; electrical equipment down by EUR 79.2 mln
or 25.2%,
- imports of motor vehicles and
parts and accessories thereof down by EUR 66.3 mln or 34.8%,
- imports of basic metals and
articles of basic metals down by EUR 21.9 mln or 19.4%,
- imports of wood and articles of
wood down by EUR 6.7 mln or 12.8%,
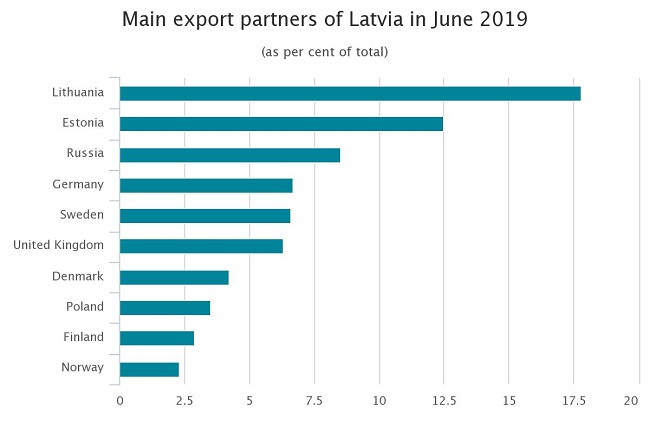
In June,
Lithuania (17.8 % of total exports), Estonia (12.5%), Germany (6.7%) and
Sweden (6.6%) were the main export partners of Latvia in trade with the EU
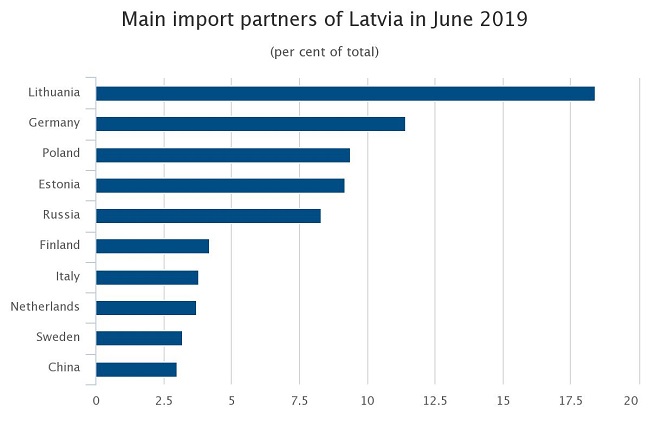
countries. Lithuania (18.4% of total imports), Germany (11.4%), Poland (9.4%)
and Estonia (9.2%) were the main import partners. Russia was the main partner
in trade with third countries; in June its share in the total Latvian exports
accounted for 8.5% and in imports for 8.3%.
In June 2019, compared to June 2018, the share of
the European Union countries in Latvian foreign trade grew – by 4.7 percentage
points in the total exports value and by 5.9 percentage points in the
imports value. The share of CIS countries went up by 0.4 percentage
points in exports and by 2.8 percentage points in imports.
Foreign
trade of Latvia in June 2019 by country group
(at current prices)
|
|
Exports |
Imports |
||||
|
|
million
euros |
% of total |
changes
as %, compared to June 2018 |
million
euros |
% of total |
changes
as %, compared to May 2018 |
|
Total |
982.9 |
100 |
-8.2 |
1 208.8 |
100 |
-11.9 |
|
European Union countries |
725.0 |
73.8 |
-1.9 |
960.1 |
79.4 |
-4.8 |
|
euro area countries |
498.7 |
50.7 |
0.7 |
717.9 |
59.4 |
-5.6 |
|
CIS countries |
125.6 |
12.8 |
-5.5 |
141.2 |
11.7 |
15.8 |
|
other countries |
132.3 |
13.4 |
-33.2 |
107.5 |
8.9 |
-55.5 |
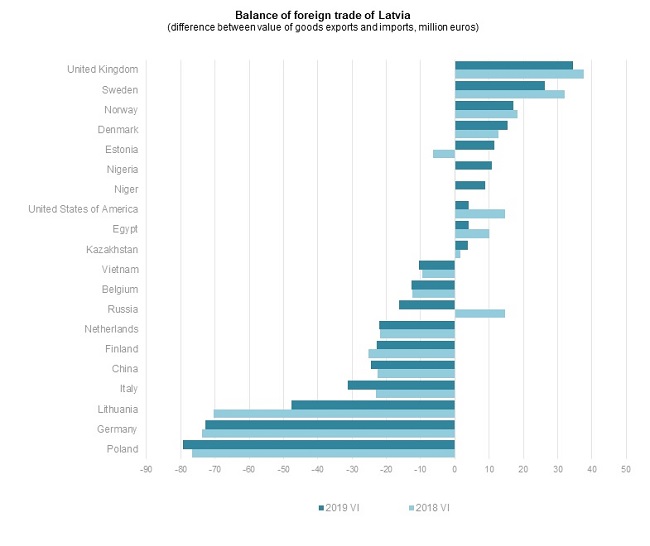
In June 2019, foreign trade balance of Latvia, as the
exports value of goods exceeded the imports value of goods, was positive with
124 partner countries. It was negative in trade with 40 countries.
In June 2019, compared to June 2018, the increase in exports
of mineral fuels, mineral oils and products of their distillation was affected
by exports of liquefied natural gas amounting to EUR 5.9 mln
(liquefied natural gas was not exported before). Exports of machinery and
mechanical appliances, in turn, declined due to the lack of exports of
turbojets, turbopropellers and other gas turbines (in June 2018, exports
thereof amounted to EUR 36.6 mln).
Main
commodities in exports of Latvia in June 2019
(at current prices)
|
|
thousand
euros |
% of total |
Changes
as %, compared to |
||
|
June 2018 |
May 2019 |
average
of previous 12 months |
|||
|
Total |
982 941 |
100 |
-8.2 |
-8.0 |
-8.2 |
|
wood and articles of wood; wood charcoal |
177.336 |
18.0 |
-9.0 |
-4.6 |
-9.5 |
|
electrical machinery and equipment |
98 428 |
10.0 |
-4.7 |
-12.7 |
-10.5 |
|
machinery and mechanical appliances |
62 129 |
6.3 |
-36.2 |
1.6 |
-20.3 |
|
vehicles other than railway or tramway rolling
stock, and parts and accessories thereof |
59 240 |
6.0 |
-0.05 |
-9.4 |
-1.0 |
|
mineral fuels, mineral oils and products of their
distillation |
50 904 |
5.2 |
0.7 |
-1.5 |
-8.1 |
|
beverages, spirits and vinegar |
43 439 |
4.4 |
0.6 |
-12.0 |
-18.4 |
|
articles of iron or steel |
35 532 |
3.6 |
-1.3 |
-10.7 |
0.7 |
|
cereals |
34 594 |
3.5 |
-21.0 |
23.8 |
3.5 |
|
pharmaceutical products |
34 554 |
3.5 |
-13.7 |
-10.6 |
-9.9 |
|
plastics and articles thereof |
29 377 |
3.0 |
-6.7 |
-7.2 |
1.6 |
In June 2019, compared to June 2018, rise in
imports of mineral fuels, mineral oils and products of their distillation was
affected by the increase in imports of natural gas (in gaseous state) of
EUR 27.8 mln or 4.3 times. Decline in imports of machinery and
mechanical appliances, in turn, was mainly influenced by the reduction in
imports of turbojets, turbopropellers and other gas turbines of
EUR 64.8 mln or 99.8%.
(at current prices)
|
|
thousand
euros |
% of total |
Changes
as %, compared to |
||
|
June 2018 |
May 2019 |
average
of previous 12 months |
|||
|
Total |
1 208 779 |
100 |
-11.9 |
-15.5 |
-10.9 |
|
mineral fuels, mineral oils and products of their
distillation |
145 600 |
12.0 |
15.6 |
7.7 |
6.0 |
|
electrical machinery and equipment |
117 791 |
9.7 |
-1.2 |
-5.0 |
-13.1 |
|
vehicles other than railway or tramway rolling
stock, and parts and accessories thereof |
117 614 |
9.7 |
-4.8 |
-14.5 |
4.3 |
|
machinery and mechanical appliances |
117 548 |
9.7 |
-39.8 |
-13.5 |
-19.4 |
|
beverages, spirits and vinegar |
54 563 |
4.5 |
2.5 |
11.3 |
11.8 |
|
plastics and articles thereof |
54 519 |
4.5 |
-3.8 |
-10.5 |
2.6 |
|
pharmaceutical products |
48 938 |
4.0 |
-13.2 |
-4.3 |
-8.0 |
|
wood and articles of wood; wood charcoal |
45 438 |
3.8 |
-13.0 |
-7.9 |
-9.4 |
|
articles of iron or steel |
35 477 |
2.9 |
5.8 |
7.4 |
12.8 |
|
iron and steel |
31 974 |
2.6 |
-39.3 |
-30.4 |
-40.7 |


 «The Baltic Course» Is Sold and Stays in Business!
