
Analytics, Inflation, Latvia, Statistics
International Internet Magazine. Baltic States news & analytics
Sunday, 28.06.2026, 05:26
Latvia: During the year, the average level of consumer prices increased by 2.9%
 Print version
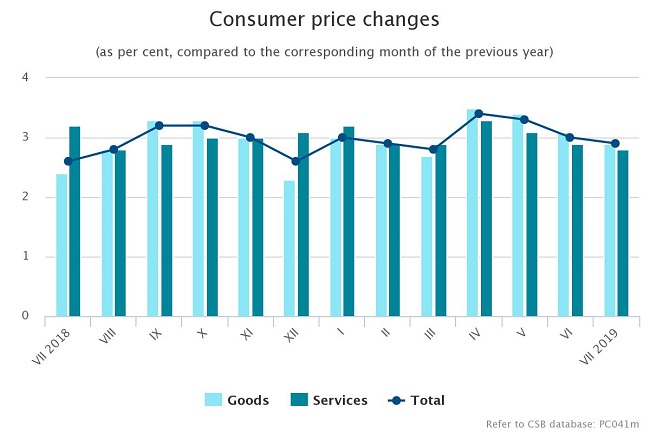
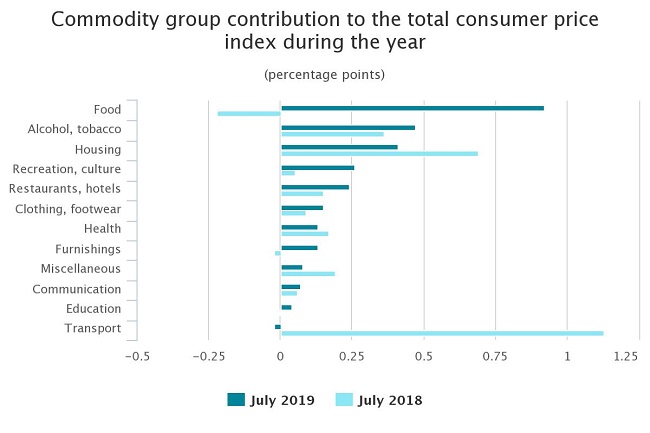
Over the year, prices within the group of food and non-alcoholic beverages increased by 4.2%. Prices of vegetables (rise of 16.8%) had the strongest upward influence on the average price level within the group. During the year, increase was recorded also in prices of bread (of 9.7%), flours and other cereals (14.5%), bakery products (3.5%), and pasta products (5.8%). Upturn was registered in prices of pork (of 11.2%), dried, salted or smoked meat (3.1%), meat products (9.1%), eggs (5.8%), chocolate (5.4%), yoghurt (4.7%), milk products (1.6%), as well as fruit and vegetable juices (4.4%). Decline, in turn, was recorded in prices of coffee (of 4.7%), poultry (2.0%), as well as cheese and curd (1.9%).
The average level of alcoholic beverage and tobacco product prices went up by 5.6%. Prices of alcoholic beverages increased by 5.7%, which was mainly influenced by the rise in prices of beer and spirits. Prices of tobacco products grew on average by 5.6%.
Over the year, prices of goods and services related to housing rose by 2.7%. Upturn was registered in prices of electricity, refuse collection, rentals for housing, solid fuels, as well as materials for the maintenance and repair of the dwelling. Decline, in turn, was observed in natural gas prices (of 9.4%).
Within the recreation and culture group, the average level of prices went up by 3.1%, which was mainly influenced by the rise in prices of pet food, television subscription fee, and flowers.
The average level of restaurant and hotel service prices went up by 4.8%. Prices of catering services grew by 4.7%, while hotel service prices went up by 7.6%.
Rise in prices of articles for household cleaning and maintenance products, garments, footwear, telecommunication services, maintenance and repair of personal transport equipment, articles for personal hygiene and beauty products, dental services, prices of services in medical specialist practice, as well as prices of pharmaceutical products had significant upward influence on the price level over the year. In its turn, the average level of prices of fuels for transport and motor vehicle insurance reduced.
Price changes by commodity group
(as %)
|
Commodity
group |
Price
changes in July 2019, compared to |
||
|
July 2018 |
December
2018 |
June 2019 |
|
|
Total |
2.9 |
2.1 |
-1.0 |
|
food |
4.2 |
2.6 |
-1.1 |
|
alcohol, tobacco |
5.6 |
6.2 |
0.4 |
|
clothing, footwear |
2.7 |
-3.6 |
-8.3 |
|
housing |
2.7 |
1.7 |
-1.0 |
|
furnishings |
2.8 |
3.2 |
0.2 |
|
health |
2.2 |
1.9 |
0.4 |
|
transport |
-0.2 |
0.8 |
-0.9 |
|
communication |
2.1 |
2.4 |
0.1 |
|
recreation, culture |
3.1 |
3.8 |
0.5 |
|
education |
2.7 |
-0.3 |
0.0 |
|
restaurants, hotels |
4.8 |
3.0 |
0.2 |
|
miscellaneous |
1.5 |
0.9 |
-1.0 |
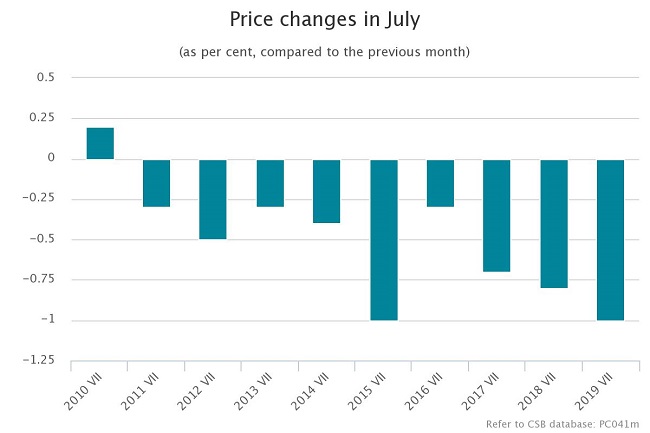
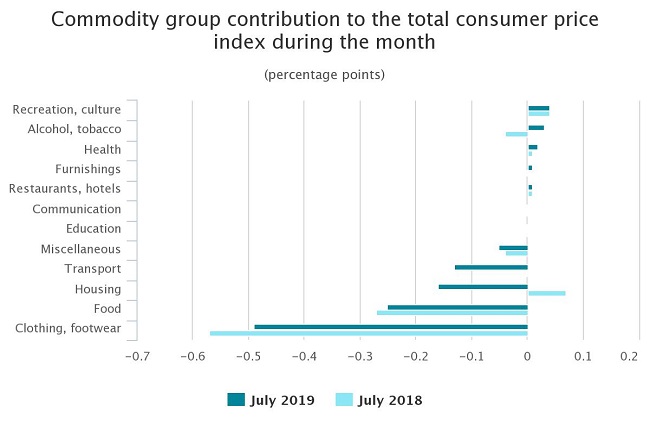
During the month, the average level of consumer prices fell by 1.0 %
Compared to June 2019, in July 2019 the average level of consumer prices decreased by 1.0%. Prices of goods fell by 1.5%, while prices of services rose by 0.3%. Decline in prices of clothing and footwear, food and non-alcoholic beverages, goods and services related to housing, goods and services related to transport, prices in miscellaneous goods and services group, as well as rise in prices of goods and services related to recreation and culture, alcoholic beverages and tobacco products exerted the greatest influence on price changes.
Over the month, prices of food and non-alcoholic beverages dropped by 1.1%. Seasonal decline (of 9.4%) in vegetable prices had the strongest lowering influence on the average price level within the group. Reduction was registered in prices of cheese and curd (of 4.9%), coffee (1.3 %), dried fruit and nuts (4.0%), pork (0.9%), and soft drinks (3.9 %). Increase, in turn, was recorded in prices of dried, salted or smoked meat (of 1.3%), fresh fruit (2.5%) and pasta products (3.3%).
The average level of alcoholic beverage and tobacco product prices went up by 0.4%. Increase was observed in prices of wine and spirits, while beer prices went down. Prices of tobacco products increased on average by 0.5%.
Due to the discounts, prices of footwear fell by 9.7% and of garments by 8.3%.
Prices of goods and services related to housing dropped on average by 1.0%, which was mainly influenced by lower natural gas tariffs as of 1 July. Upturn was observed in rentals for housing.
Within the group of goods and services related to transport, the strongest downward influence was exerted by prices of fuel (of 2.2%), of which prices of diesel fell by 2.6%, of petrol by 1.9%, and of auto gas by 0.3%. Decline was also registered in prices of passenger transport by air (of 1.5%).
Price level within the group of recreation and culture increased by 0.5%. Prices of package holidays (rise of 3.1%) had the greatest influence on the price rise. Increase was registered in prices of pet food. Decline, in turn, was observed in flower prices.
Within the miscellaneous goods and services group, the average level of prices fell by 1.0%, which, mainly influenced by the end of sales campaigns, resulted from the decline in prices of articles for personal hygiene and beauty products.
Information on consumer price changes in August 2019 will be published on 9 September.
* The annual inflation reflects consumer price changes, comparing the average price level in the comparison month with the average price level in the corresponding month of the previous year.


 «The Baltic Course» Is Sold and Stays in Business!
