
Analytics, Foreign trade , Latvia, Statistics
International Internet Magazine. Baltic States news & analytics
Thursday, 09.04.2026, 20:00
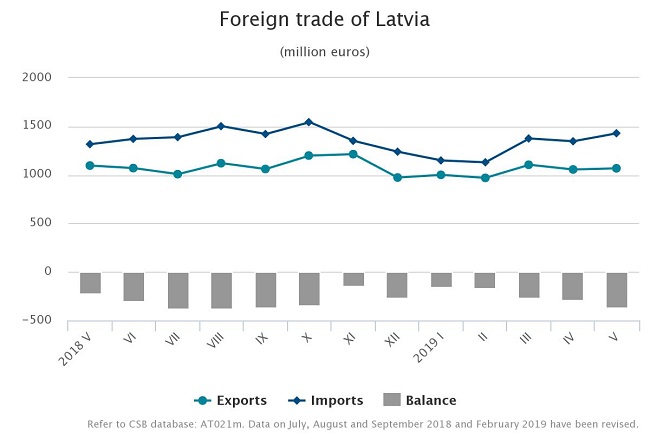
In May foreign trade turnover of Latvia was 3.5% larger than a year ago
 Print version
Calendar
and seasonally adjusted data show that, compared to May 2018, in
May 2019 the exports value at current prices fell by 3.2% , the imports
value grew by 12%, whereas, compared to the previous month, the exports value
decreased by 2.2 %, but the imports value increased by 3.4%.
Main
changes in exports in May 2019, compared to May 2018:
- exports of vegetable products
up by EUR 22.1 mln or 61.9%,
- exports of miscellaneous
manufactured articles up by EUR 6.5 mln or 18.6%,
- exports of machinery and
mechanical appliances; electrical equipment down by EUR 42.5 mln
or 19.7%,
- exports of wood and articles of
wood up by EUR 14.7 mln or 7.3%,
- exports of basic metals and
articles of basic metals down by EUR 6.6 mln or 6.1%.
Main
changes in imports in May 2019, compared to May 2018:
- imports of vehicles and
associated transport equipment up by EUR 134.6 mln or 99.7%,
- imports of mineral products up
by EUR 24.7 mln or 21.2%,
- imports of products of the
chemical and allied industries up by EUR 11.8 mln or 9.9%,
- imports of machinery and
mechanical appliances; electrical equipment down by EUR 58.5 mln
or 18.4%
- imports of basic metals and
articles of basic metals down by EUR 15.7 mln or 13%.
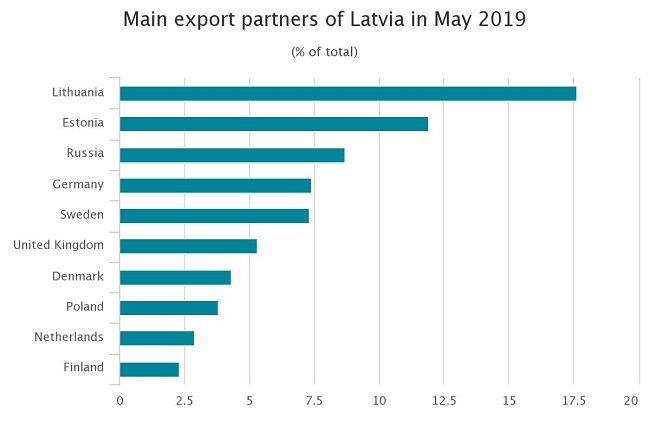
In May, the
main export partners of Latvia in trade with EU countries were Lithuania (17.6%
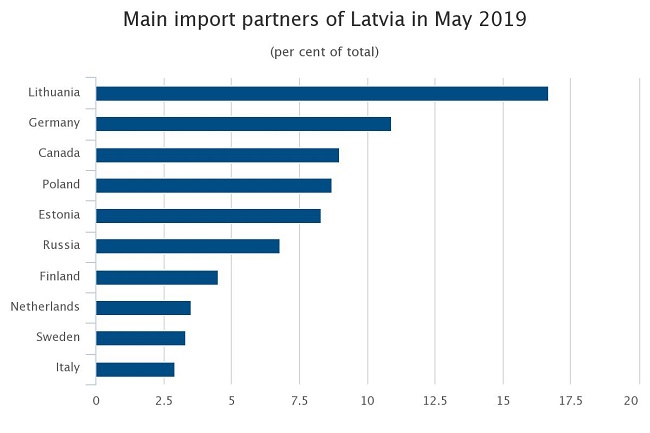
of total exports), Estonia (11.9%), Germany (7.4%) and Sweden (7.3%), whereas
the main import partners were Lithuania (16.7% of total imports), Germany (10.9%),
Poland (8.7%) and Estonia (8.3%). The main partner in trade with third
countries was Russia, share of which in total Latvian exports in May accounted
for 8.7%, but in imports – Canada with 9% in total imports.
In May 2019, compared to May 2018, share of the European Union countries grew in total exports value – by 3 percentage points, but in imports value – fell by 3.8 percentage points. Rise in share of CIS countries comprised 0.4 percentage points in exports and 0.6 percentage points in imports.
Foreign
trade of Latvia by country groups in May 2019
(at current prices)
|
|
Exports |
Imports |
||||
|
|
million EUR |
% of total |
changes
as %, compared to May 2018 |
million EUR |
% of total |
changes
as %, compared to May 2018 |
|
Total |
1 068.3 |
100 |
-2.6 |
1 430.0 |
100 |
8.6 |
|
European Union countries |
790.2 |
74.0 |
1.5 |
1 042.6 |
72.9 |
3.2 |
|
euro area countries |
539.6 |
50.5 |
2.6 |
782.9 |
54.7 |
3.3 |
|
CIS countries |
134.6 |
12.6 |
0.8 |
146.0 |
10.2 |
15.5 |
|
other countries |
143.5 |
13.4 |
-22.2 |
241.4 |
16.9 |
34.1 |
In May 2019 foreign trade balance of Latvia was positive with 128 partner countries, as exports value of goods exceeded imports value of goods. It was negative in trade with 39 countries.
Balance of foreign trade of Latvia
(difference in export and import values of goods, million EUR)

In May 2019, compared to May 2018, rise in exports of furniture, other furnishing articles; prefabricated buildings was affected by increase in exports of mobile homes by EUR 1.3 mln or 3.5 times. But exports of machinery and mechanical appliances reduced as exports of turbojets, turbopropellers and other gas turbines dropped by EUR 56.3 mln or 98.2%.
Main
commodities in exports of Latvia in May 2019
(at current prices)
|
|
Thousand EUR |
As %
of total |
Changes
as %, compared to |
||
|
May 2018 |
April 2019 |
average
of previous 12 months |
|||
|
Total |
1 068 277 |
100 |
-2.6 |
1.1 |
-0.4 |
|
wood and articles of wood; wood charcoal |
185 879 |
17.4 |
-7.3 |
-8.5 |
-5.6 |
|
electrical machinery and equipment |
112 738 |
10.6 |
12.3 |
8.5 |
3.8 |
|
vehicles other than railway or tramway rolling
stock, and parts and accessories thereof |
65 389 |
6.1 |
0.3 |
8.1 |
9.3 |
|
machinery and mechanical appliances |
61 152 |
5.7 |
-47.3 |
-0.6 |
-25.8 |
|
mineral fuels, mineral oils and products of their
distillation |
51 672 |
4.8 |
-0.1 |
-3.7 |
-6.1 |
|
beverages, spirits and vinegar |
49 382 |
4.6 |
-9.2 |
34.6 |
-7.9 |
|
iron and steel |
41 714 |
3.9 |
-17.5 |
-6.2 |
0.4 |
|
articles of iron and steel |
39 811 |
3.7 |
15.2 |
10.8 |
13.7 |
|
pharmaceutical products |
38 663 |
3.6 |
6.8 |
-13.1 |
1.3 |
|
furniture, other furnishing articles; prefabricated
buildings |
35 064 |
3.3 |
18.3 |
15.5 |
16.9 |
Rise of imports in commodity group "aircraft, spacecraft, and parts thereof” in May 2019, compared to May 2018, was affected by purchase of aircrafts of EUR 126.7 mln, but imports of machinery and mechanical appliances fell as imports of turbojets, turbopropellers and other gas turbines reduced by EUR 60.7 mln or 98.8 %.
Main
commodities in imports of Latvia in May 2019
(at current prices)
|
|
Thousand EUR |
As %
of total |
Changes
as %, compared to |
||
|
May 2018 |
April 2019 |
average
of previous 12 months |
|||
|
Total |
1 429 967 |
100 |
8.6 |
6.2 |
6.3 |
|
vehicles other than railway or tramway rolling
stock, and parts and accessories thereof |
137 596 |
9.6 |
5.8 |
21.3 |
22.8 |
|
machinery and mechanical appliances |
135 891 |
9.5 |
-29.9 |
4.5 |
-9.5 |
|
mineral fuels, mineral oils and products of their
distillation |
135 162 |
9.5 |
21.8 |
38.4 |
-0.1 |
|
aircraft, spacecraft and parts thereof |
129 763 |
9.1 |
46.4 times |
98.2 |
2.6 times |
|
electrical machinery and equipment |
123 937 |
8.7 |
-0.5 |
-3.8 |
-8.2 |
|
plastics and articles thereof |
60 936 |
4.3 |
7.1 |
4.4 |
15.5 |
|
pharmaceutical products |
51 130 |
3.6 |
11.2 |
-27.0 |
-2.9 |
|
wood and articles of wood; wood charcoal |
49 348 |
3.5 |
-9.1 |
-4.2 |
-2.4 |
|
beverages, spirits and vinegar |
49 030 |
3.4 |
-10.6 |
31.9 |
-0.6 |
|
iron and steel |
45 946 |
3.2 |
-24.5 |
-28.7 |
-16.8 |


 «The Baltic Course» Is Sold and Stays in Business!
