
Analytics, Foreign trade , Lithuania, Statistics
International Internet Magazine. Baltic States news & analytics
Saturday, 21.03.2026, 01:47
Lithuania: International trade in services in I quarter 2019
 Print version
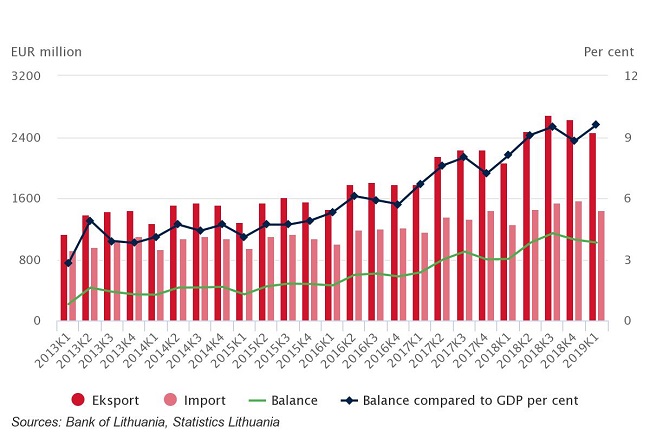
Structure and changes of exports and imports of services,
I quarter 2019
|
|
Exports |
Imports |
||||
|
EUR
million |
share,
% |
change,
against I quarter 2018, % |
EUR
million |
share,
% |
change,
against I quarter 2018, % |
|
|
Total
services |
2,468.0 |
100.0 |
19.2 |
1,449.7 |
100.0 |
14.6 |
|
Technical
maintenance and repair services |
77.0 |
3.1 |
38.6 |
42.6 |
2.9 |
24.9 |
|
Transport
services |
1,554.8 |
63.0 |
24.4 |
790.2 |
54.5 |
18.8 |
|
Passengers
services |
16.9 |
0.7 |
-58.1 |
32.8 |
2.3 |
-7.8 |
|
Freight
services |
932.9 |
37.8 |
31.5 |
402.8 |
27.8 |
28.2 |
|
Other
transport services |
605.0 |
24.5 |
20.9 |
354.6 |
24.4 |
12.4 |
|
Travel |
207.5 |
8.4 |
1.8 |
196.6 |
13.6 |
1.0 |
|
Construction |
70.7 |
2.9 |
16.6 |
22.9 |
1.6 |
3.2
times |
|
Financial
services |
33.8 |
1.4 |
3.1 |
38.8 |
2.7 |
–5.1 |
|
Telecommunications,
computer and information services |
147.1 |
6.0 |
14.3 |
82.7 |
5.7 |
10.8 |
|
Telecommunications
services |
18.6 |
0.8 |
–16.5 |
22.9 |
1.6 |
6.1 |
|
Computer
services |
123.4 |
5.0 |
21.6 |
54.8 |
3.8 |
14.0 |
|
Information
services |
5.1 |
0.2 |
3.1 |
5.0 |
0.3 |
0.4 |
|
Other
business services |
256.1 |
10.4 |
32.4 |
217.8 |
15.0 |
9.3 |
|
Research
and technological development services |
10.3 |
0.4 |
27.7 |
2.0 |
0.1 |
–1.0 |
|
Professional
and advisory management services |
73.3 |
3.0 |
8.3 |
56.8 |
3.9 |
5.1 |
|
Technical,
trade-related and other business services |
172.5 |
7.0 |
46.5 |
159.0 |
11.0 |
11.1 |
|
Other
undistributed services |
121.0 |
4.8 |
–16.6 |
58.1 |
4.0 |
16.9 |


 «The Baltic Course» Is Sold and Stays in Business!
