
Analytics, Estonia, Industry, Statistics
International Internet Magazine. Baltic States news & analytics
Friday, 26.04.2024, 08:23
In April, the total industrial production in Estonia remained the same y-o-y
 Print version
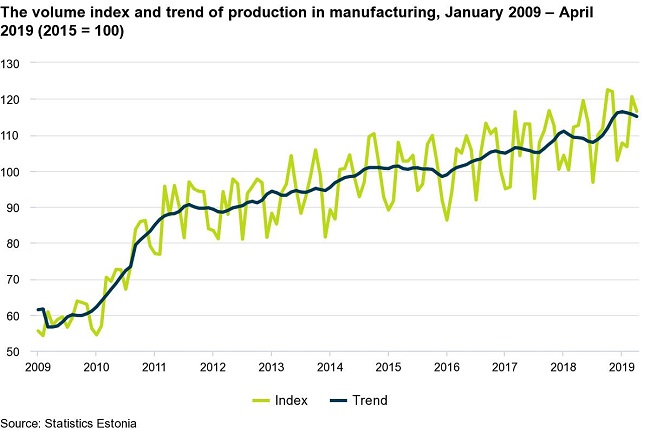
In April, the total production in manufacturing was 3% higher than in the corresponding month of 2018. In April, over a half of the branches of industry exceeded the volume of the same month of the previous year. The growth in production was mostly due to an increase in the manufacture of food products, computers and electronic products and furniture. Among the branches of industry with larger shares, production fell in the manufacture of wood and fabricated metal products.
In April, 68% of the total production of manufacturing was sold to the external market. According to unadjusted data, compared to April 2018, the sales of manufacturing production for exports increased by 8% and sales to the domestic market by 9%.
In April 2019, compared to March, the seasonally adjusted total industrial production decreased by 1% and the production of manufacturing fell by 2%.
Compared to April 2018, the production of electricity decreased by 37% and the production of heat remained at the same level.
Change in volume index of industrial production, April
2019 | ||||
Economic activity | Change on previous month according to seasonally
adjusted dataa | Change on same month of previous year |
| |
according to unadjusted data | according to working-day adjusted datab |
| ||
TOTAL | -1.4 | -0.4 | -0.4 |
|
Energy production | 1.3 | -23.3 | -23.3 |
|
Mining | 2.3 | -16.1 | -16.1 |
|
Manufacturing | -2.4 | 3.5 | 3.5 |
|
manufacture of wood and wood products | 0.7 | -1.0 | -1.0 |
|
manufacture of food products | 1.5 | 4.1 | 4.1 |
|
manufacture of computers, electronic and optical
products | -3.2 | 17.4 | 17.4 |
|
manufacture of fabricated metal products | -14.1 | -10.0 | -10.0 |
|
manufacture of electrical equipment | 1.8 | -0.5 | -0.5 |
|
manufacture of furniture | -4.8 | 11.6 | 11.6 |
|
manufacture of motor vehicles | -3.8 | -2.5 | -2.5 |
|
manufacture of building materials | -1.6 | 11.7 | 11.7 |
|
manufacture of machinery and equipment | -14.7 | 1.5 | 1.5 |
|
manufacture of chemical products | -4.4 | -0.3 | -0.3 |
|
a In the case of the seasonally adjusted
volume index, the impact of different number of working days in a month and
seasonally recurring factors has been eliminated. It is calculated only in
comparison with the previous period.
b In the case of the working-day adjusted
volume index, the impact of different number of working days in a month has
been eliminated. It is calculated only in comparison with the corresponding
period of the previous year.


 «The Baltic Course» Is Sold and Stays in Business!
