
Analytics, Foreign trade , Latvia, Statistics
International Internet Magazine. Baltic States news & analytics
Sunday, 05.04.2026, 18:08
In February foreign trade turnover of Latvia was 0.4% smaller than a year ago
 Print version
In February, Latvia exported goods in the amount of EUR 959 million, but imported – in the amount of EUR 1.1 bn. Compared to February 2018, foreign trade balance has improved as exports in total foreign trade amount increased from 45.9% to 46.6%.
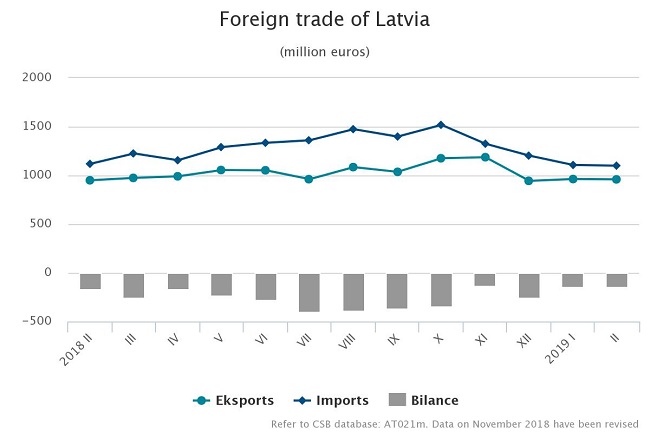
Over the first two months of this year, the foreign trade turnover of Latvia at current prices reached EUR 4.13 bn – EUR 11.8 mln or 0.3% less than in the corresponding period of 2018. The exports value comprised EUR 1.92 bn (an increase of EUR 3.2 mln or 0.2%), whereas the imports value - EUR 2.21 bn (a drop of EUR 15 mln or 0.7%).
Calendar and seasonally adjusted data show that, compared to February 2018, in February 2019 the exports value at current prices went up by 0.8%, but the imports value – down by 1.2%, whereas, compared to the previous month, the exports value decreased by 0.02% and the imports value – by 1%.
Main changes in exports in February 2019, compared to February 2018:
- exports of wood and articles of wood up by EUR 27.2 mln or 16.7%,
- exports of products of the chemical and allied industries up EUR 10.5 mln or 14.7%,
- exports of prepared foodstuffs up by EUR 9.2 mln or 11.9%,
- exports of machinery and mechanical appliances; electrical equipment down by EUR 24.1 mln or 13.8%,
- exports of vegetable products down by EUR 11.5 mln or 18.7%.
Main changes in imports in February 2019, compared to February 2018:
- imports of prepared foodstuffs up by EUR 6.7 mln or 7%,
- imports of wood and articles of wood up by EUR 5.8 mln or 13.1%,
- imports of miscellaneous manufactured articles up by EUR 5.1 mln or 19.1%,
- imports of vehicles, aircraft, vessels and associated transport equipment down by EUR 36.8 mln or 26.3%,
- imports of machinery and mechanical appliances; electrical equipment down by EUR 9.7 mln or 4.1%.
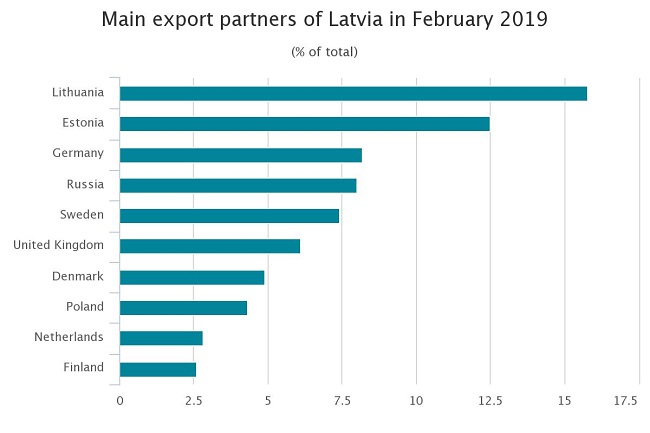
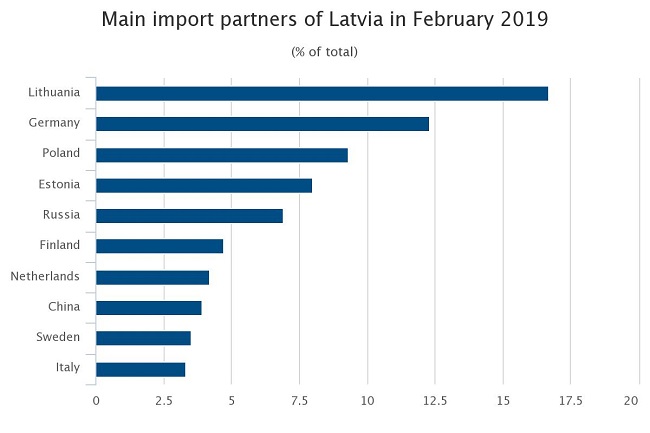
In February, the main export partners of Latvia in trade with EU countries were Lithuania (15.8% of total exports), Estonia (12.5%), Germany (8.2%) and Sweden (7.4%), whereas the main import partners were Lithuania (16.7% of total imports), Germany (12.3%), Poland (9.3%) and Estonia (8%). Russia was the main partner in trade with third countries; its share in total Latvian exports in February accounted for 8%, whereas in imports – for 6.9%.
In February 2019, compared to February 2018, share of the European Union countries increased both in total exports and imports value – by 4.2 and 3 percentage points, respectively. Drop in share of CIS countries comprised 0.7 percentage points in exports, but in imports there was a rise of 1.3 percentage points.
Foreign
trade of Latvia by country groups in February 2019,
(at current prices)
|
|
Exports |
Imports |
||||
|
|
million EUR |
% of total |
changes as %, compared to February 2018 |
million EUR |
% of total |
changes as %, compared to February 2018 |
|
Total |
959.0 |
100 |
1.0 |
1 099.5 |
100 |
-1.7 |
|
European
Union countries |
727.0 |
75.8 |
6.9 |
860.6 |
78.3 |
2.2 |
|
euro area
countries |
485.2 |
50.6 |
8.2 |
637.8 |
58.0 |
2.2 |
|
CIS
countries |
111.3 |
11.6 |
-4.8 |
121.8 |
11.1 |
11.3 |
|
other
countries |
120.7 |
12.6 |
-20.9 |
117.1 |
10.7 |
-29.9 |
As exports value of goods in February 2019 exceeded imports value of goods, foreign trade balance of Latvia was positive with 117 partner countries. It was negative in trade with 43 countries.
Rise of exports of wood and wood products; wood charcoal in February 2019, as compared to February 2018, was affected by the increase in exports of fuelwood of EUR 17.3 mln or 99.4%. But exports of machinery and mechanical appliances reduced as exports of turbojets, turbopropellers and other gas turbines dropped by EUR 22.3 mln.
Main
commodities in exports of Latvia in February 2019
(at current prices)
|
|
Thousand EUR |
as % of total |
Changes as %, compared to |
||
|
February 2018 |
January 2019 |
average of previous 12 months |
|||
|
Total |
959 006 |
100 |
1.0 |
-0.4 |
-7.0 |
|
wood and
articles of wood; wood charcoal |
189 817 |
19.8 |
16.7 |
-8.8 |
-0.6 |
|
electrical
machinery and equipment |
98 894 |
10.3 |
-4.3 |
-7.3 |
-6.4 |
|
vehicles
other than railway or tramway rolling stock, and parts and accessories
thereof |
55 407 |
5.8 |
-9.2 |
-7.6 |
-6.9 |
|
machinery
and mechanical appliances |
51 425 |
5.4 |
-27.7 |
3.6 |
-35.6 |
|
beverages,
spirits and vinegar |
46 199 |
4.8 |
16.2 |
14.9 |
-12.3 |
|
iron and
steel |
40 997 |
4.3 |
-13.1 |
2.4 times |
1.9 |
|
pharmaceutical
products |
37 701 |
3.9 |
8.7 |
15.7 |
3.0 |
|
articles
of iron and steel |
35 884 |
3.7 |
10.9 |
19.2 |
5.5 |
|
mineral
fuels, mineral oils and products of their distillation |
34 559 |
3.6 |
-9.1 |
-12.0 |
-12.6 |
|
furniture,
other furnishing articles; prefabricated buildings |
28 510 |
3.0 |
15.0 |
3.1 |
-3.7 |
Rise of imports of alcoholic and non-alcoholic beverages in February 2019, as compared to February 2018, was affected by the increase in imports of whiskey by EUR 3.2 mln or 30.1%. In turn, reduction in imports of machinery and mechanical appliances was mostly influenced by decrease in imports of turbojets, turbopropellers and other gas turbines by EUR 13.6 mln or 96.8%.
Main
commodities in exports of Latvia in February 2019
(at current prices)
|
|
Thousand EUR |
as % of total |
Changes as %, compared to |
||
|
February 2018 |
January 2019 |
average of previous 12 months |
|||
|
Total |
959 006 |
100 |
1.0 |
-0.4 |
-7.0 |
|
wood and
articles of wood; wood charcoal |
189 817 |
19.8 |
16.7 |
-8.8 |
-0.6 |
|
electrical
machinery and equipment |
98 894 |
10.3 |
-4.3 |
-7.3 |
-6.4 |
|
vehicles
other than railway or tramway rolling stock, and parts and accessories
thereof |
55 407 |
5.8 |
-9.2 |
-7.6 |
-6.9 |
|
machinery
and mechanical appliances |
51 425 |
5.4 |
-27.7 |
3.6 |
-35.6 |
|
beverages,
spirits and vinegar |
46 199 |
4.8 |
16.2 |
14.9 |
-12.3 |
|
iron and
steel |
40 997 |
4.3 |
-13.1 |
2.4 times |
1.9 |
|
pharmaceutical
products |
37 701 |
3.9 |
8.7 |
15.7 |
3.0 |
|
articles
of iron and steel |
35 884 |
3.7 |
10.9 |
19.2 |
5.5 |
|
mineral
fuels, mineral oils and products of their distillation |
34 559 |
3.6 |
-9.1 |
-12.0 |
-12.6 |
|
furniture,
other furnishing articles; prefabricated buildings |
28 510 |
3.0 |
15.0 |
3.1 |
-3.7 |


 «The Baltic Course» Is Sold and Stays in Business!
