
Analytics, Inflation, Lithuania, Statistics
International Internet Magazine. Baltic States news & analytics
Friday, 26.04.2024, 07:27
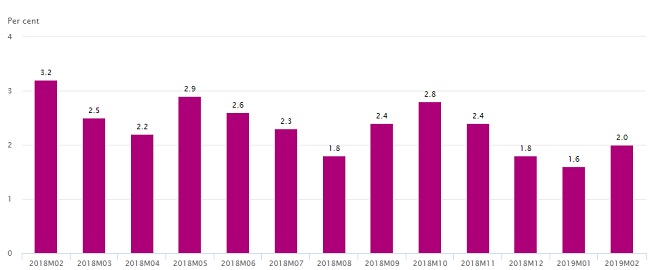
Changes in prices calculated based on the HIC in Lithuania
 Print version
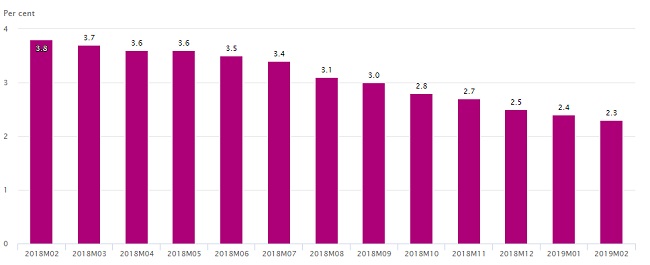
Fig. 1. Average annual inflation calculated based on the HICP
ECOICOP1 divisions of consumer goods and services | Relative share (weight) in total consumption expenditure, ‰ | Price growth, drop (–), % | ||
|---|---|---|---|---|
February 2019, against | Average annual | |||
January 2019 | February 2018 | |||
Consumption goods and services | 1 000.0 | 0.2 | 2.0 | 2.3 |
Food products and non-alcoholic beverages | 197.9 | 0.8 | 1.4 | 1.2 |
Alcoholic beverages and tobacco products | 73.4 | 0.0 | 2.8 | 2.7 |
Clothing and footwear | 67.9 | –2.0 | –2.9 | –0.5 |
Housing, water, electricity, gas and other fuels | 111.4 | 0.2 | 5.3 | 3.2 |
Furnishings, household equipment and routine maintenance | 72.0 | 0.6 | 2.2 | 1.0 |
Health care | 59.4 | 0.3 | 4.7 | 2.1 |
Transport | 154.7 | –0.3 | –0.1 | 4.1 |
Communications | 28.0 | 0.2 | 0.1 | –1.2 |
Recreation and culture | 84.0 | 0.7 | 1.0 | 2.0 |
Education | 13.3 | 0.1 | 3.1 | 3.2 |
Hotels, cafes and restaurants | 61.9 | 0.5 | 5.3 | 5.2 |
Miscellaneous goods and services | 76.1 | 0.8 | 3.8 | 3.0 |


 «The Baltic Course» Is Sold and Stays in Business!
