
Analytics, Foreign trade , Latvia, Statistics
International Internet Magazine. Baltic States news & analytics
Monday, 30.03.2026, 08:40
In January foreign trade turnover of Latvia was 0.1 % smaller than a year ago
 Print version
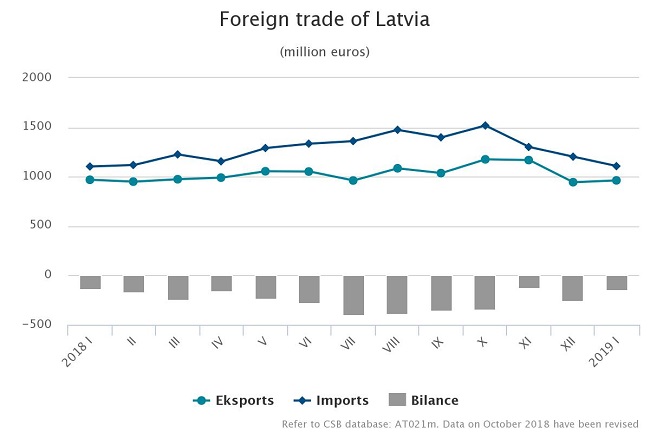
Calendar
and seasonally adjusted data show that, compared to January 2018, in
January 2019 the exports value at current prices went down by 1.8%, but
the imports value – up by 0.6%, whereas, compared to the previous month, the
exports value increased by 0.2%, but the imports value – reduced by 3.2%.
Main
changes in exports in January 2019, compared to January 2018:
- exports of wood and articles of
wood up by EUR 49.5 mln or 31.2%,
- exports of prepared foodstuffs
up by EUR 7.8 mln or 10.6%,
- exports of machinery and
mechanical appliances; electrical equipment down by EUR 39.3 mln
or 20.1%,
- exports of basic metals and
articles of basic metals down by EUR 26.2 mln or 29.7%,
- exports of vegetable products
down by EUR 11.5 mln or 16.4%.
Main
changes in imports in January 2019, compared to January 2018:
- imports of prepared foodstuffs
up by EUR 8.9 mln or 10.1%,
- imports of wood and articles of
wood up by EUR 7 mln or 16.9%,
- imports of mineral products
down by EUR 14.1 mln or 16.7%,
- imports of vehicles, aircraft,
vessels and associated transport equipment down by EUR 11.1 mln
or 10.9%,
- imports of machinery and
mechanical appliances; electrical equipment down by EUR 8.6 mln
or 3.2%.
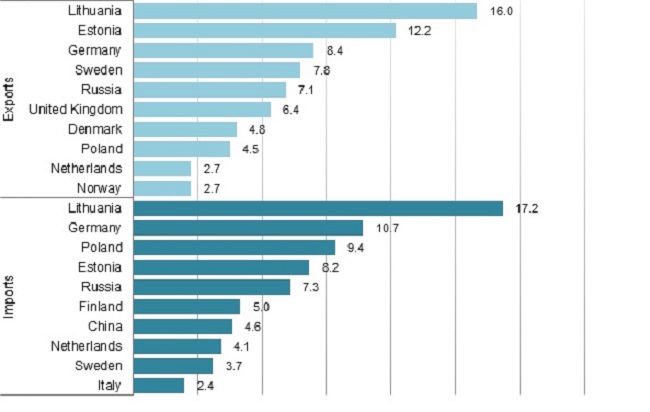
In January,
the main export partners of Latvia in trade with EU countries were Lithuania
(16% of total exports), Estonia (12.2%), Germany (8.4%) and Sweden (7.8%),
whereas the main import partners were Lithuania (17.2% of total imports),
Germany (10.7%), Poland (9.4%) and Estonia (8.2%).
Russia was
the main partner in trade with third countries; its share in total Latvian
exports in January accounted for 7.1%, whereas in imports – for 7.3%.
In January 2019, compared to January 2018, share
of the European Union countries increased both in total exports and imports
value – by 4.5 percentage points and 1 percentage point, respectively.
Rise in share of CIS countries comprised 1.4 percentage points in exports
and 0.2 percentage points – in imports.
Foreign trade of Latvia in January 2019 by country group
(at current prices)
Exports | Imports | |||||
| million EUR | % of total | changes as %, compared to January 2018 | million EUR | % of total | changes as %, compared to January 2018 |
Total | 962.5 | 100 | -0.6 | 1 106.7 | 100 | 0.3 |
European Union countries | 735.0 | 76.4 | 5.5 | 839.0 | 75.8 | 1.7 |
euro area countries | 486.1 | 50.5 | 3.8 | 614.9 | 55.6 | 0.1 |
CIS countries | 101.9 | 10.6 | 14.9 | 120.5 | 10.9 | 2.5 |
other countries | 125.6 | 13.0 | -31.4 | 147.2 | 13.3 | -8.4 |
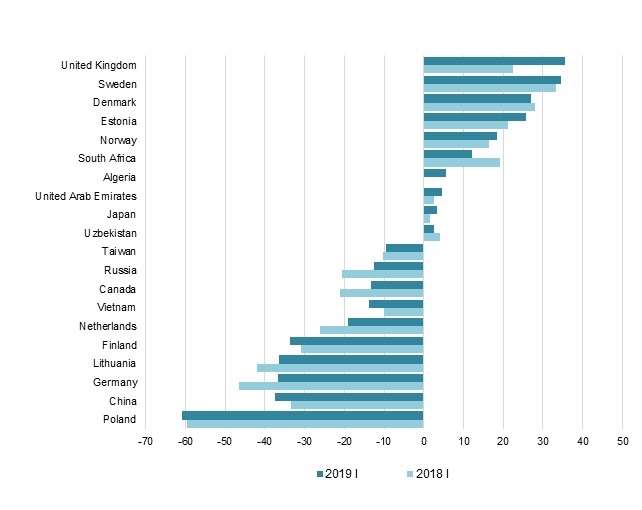
As exports value of goods in January 2019 exceeded
imports value of goods, foreign trade balance of Latvia was positive with 116
partner countries. It was negative in trade with 49 countries.
Rise of exports of wood and wood products; wood charcoal in
January 2019, as compared to January 2018, was affected by the
increase in exports of fuelwood of EUR 23 mln or 97.1%. But exports
of machinery and mechanical appliances reduced as exports of turbojets,
turbopropellers and other gas turbines dropped by EUR 41.1 mln or
98.9%.
| thousand EUR | as % of total | Changes as %, compared to | ||
January 2018 | December 2018 | average of previous 12 months | |||
Total | 962 523 | 100 | -0.6 | 2.0 | -6.5 |
wood and articles of wood; wood charcoal | 208 088 | 21.6 | 31.3 | 23.3 | 11.3 |
electrical machinery and equipment | 106 669 | 11.1 | 3.3 | -0.1 | 2.0 |
vehicles other than railway or tramway rolling stock, and parts and accessories thereof | 59 935 | 6.2 | 10.9 | 17.1 | 1.9 |
machinery and mechanical appliances | 49 642 | 5.2 | -46.3 | -12.1 | -40.1 |
beverages, spirits and vinegar | 40 211 | 4.2 | 18.9 | -26.6 | -23.0 |
mineral fuels, mineral oils and products of their distillation | 39 255 | 4.1 | -13.0 | 7.4 | -2.8 |
cereals | 35 287 | 3.7 | -6.9 | 13.7 | 19.8 |
pharmaceutical products | 32 596 | 3.4 | 1.5 | -12.3 | -10.5 |
articles of iron and steel | 30 092 | 3.1 | -5.0 | 8.3 | -11.9 |
plastics and articles thereof | 28 015 | 2.9 | 16.9 | 18.0 | 2.5 |
Rise of imports of alcoholic and non-alcoholic beverages in January 2019, as compared to January 2018, was affected by the increase in imports of whiskey by EUR 3.8 mln or 58.9%. In turn, reduction in imports of mineral fuels, mineral oils and products of their distillation was mostly influenced by decrease of imports of diesel oil by EUR 6 mln or 14.6%.
| thousand EUR | as % of total | Changes as %, compared to | ||
January 2018 | December 2018 | average of previous 12 months | |||
Total | 1 106 743 | 100 | 0.3 | -8.0 | -14.2 |
electrical machinery and equipment | 143 934 | 13.0 | -3.3 | 18.2 | 9.5 |
machinery and mechanical appliances | 116 368 | 10.5 | -3.1 | -19.8 | -22.7 |
vehicles other than railway or tramway rolling stock, and parts and accessories thereof | 86 706 | 7.8 | -13.3 | -19.8 | -21.6 |
mineral fuels, mineral oils and products of their distillation | 64 122 | 5.8 | -19.5 | -8.4 | -45.2 |
iron and steel | 54 898 | 5.0 | 0.4 | 7.5 | -1.0 |
pharmaceutical products | 48 566 | 4.4 | 3.5 | 17.3 | -2.4 |
wood and articles of wood; wood charcoal | 48 493 | 4.4 | 16.7 | 12.5 | -0.4 |
plastics and articles thereof | 47 931 | 4.3 | -1.0 | 15.8 | -8.1 |
beverages, spirits and vinegar | 35 001 | 3.2 | 18.7 | -26.3 | -28.6 |
articles of iron and steel | 25 448 | 2.3 | -7.9 | -6.3 | -18.7 |


 «The Baltic Course» Is Sold and Stays in Business!
