
Analytics, Estonia, Foreign trade , Statistics
International Internet Magazine. Baltic States news & analytics
Thursday, 02.04.2026, 12:30
In January, exports growth continued in Estonia
 Print version
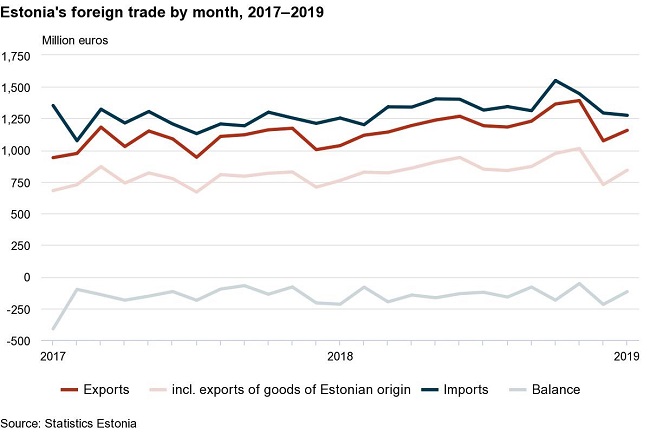
In January, exports from Estonia amounted to 1.16 bn euros and imports to Estonia to 1.28 bn euros. The trade deficit was 119 mln euros, which was 99 mln euros less than in the same period last year.
In January, the top destination countries of Estonia’s exports were Finland (16% of Estonia’s total exports), Sweden and Latvia (both 10%). Electrical equipment and base metals and articles of base metal were the main commodities exported to Finland; wood and articles of wood and electrical equipment to Sweden; mineral products, and agricultural products and food preparations to Latvia. The biggest increase occurred in exports to the USA (up by 66 mln euros), Singapore (up by 30 mln euros) and Denmark (up by 18 mln euros). In exports to the USA, there was an increase in the exports of data communication equipment, and to Singapore and Denmark, in the exports of mineral products. The biggest decrease occurred in exports to the Netherlands (down by 34 mln euros), where less mineral products were dispatched.
The biggest share in exports was held by electrical equipment (17% of Estonia’s total exports), followed by mineral products (14%), and wood and articles of wood (11%). The greatest increase was in the exports of mineral products (up by 37 million euros), electrical equipment (up by 25 mln euros), mechanical appliances and wood and articles of wood (both up by 19 mln euros).
The share of goods of Estonian origin in total exports was 73% in January. The exports of goods of Estonian origin grew by 11% and re-exports by 14%. In the exports of goods of Estonian origin, the biggest growth was in the exports of electrical equipment (data communication equipment, electrical cabinets), wood and articles of wood (wood pellets, glue-laminated timber, coniferous sawn timber) and mineral products (shale oil, electricity).
The main countries of consignment in January were Finland (12% of Estonia’s total imports), Lithuania (11%) and Germany (10%). Mineral products and electrical equipment were the main commodities imported from Finland, while from Lithuania, these were mineral products, and from Germany, transport equipment and mechanical appliances. Imports increased the most from Lithuania (up by 47 million euros) and China (up by 13 million euros). Mineral products were imported more from Lithuania and electrical equipment from China. Imports decreased the most from the Netherlands.
The main commodities imported to Estonia were mineral products (16% of Estonia’s total imports), electrical equipment (14%), and transport equipment (10%). The biggest increase was in the imports of mineral products (up by 34 mln euros) and raw materials and products of chemical industry (up by 11 mln euros).
| Month | Exports, million euros | Imports, million euros | Balance, million euros | |||||
|---|---|---|---|---|---|---|---|---|
| 2018 | 2019 | change, % | 2018 | 2019 | change, % | 2017 | 2018 | |
| January | 1,035 | 1,156 | 12 | 1,253 | 1,275 | 2 | -218 | -119 |
| Country of destination, group of countries | Exports, million euros | Share, % | Change on same month of previous year, % | Country of consignment, group of countries | Imports, million euros | Share, % | Change on same month of previous year, % |
|---|---|---|---|---|---|---|---|
| TOTAL | 1,156 | 100 | 12 | TOTAL | 1,275 | 100 | 2 |
| EU-28 | 817 | 71 | 5 | EU-28 | 987 | 77 | 1 |
| Euro area 19 | 569 | 49 | 7 | Euro area 19 | 711 | 56 | 0 |
| Non-EU | 339 | 29 | 31 | Non-EU | 289 | 23 | 4 |
| 1. Finland | 190 | 16 | 9 | 1. Finland | 157 | 12 | -3 |
| 2. Sweden | 121 | 10 | -7 | 2. Lithuania | 143 | 11 | 48 |
| 3. Latvia | 114 | 10 | 16 | 3. Germany | 131 | 10 | 0 |
| 4. USA | 99 | 9 | - | 4. Sweden | 119 | 9 | 8 |
| 5. Germany | 86 | 7 | 21 | 5. Latvia | 115 | 9 | 3 |
| 6. Lithuania | 61 | 5 | -4 | 6. Russia | 91 | 7 | 7 |
| 7. Denmark | 53 | 5 | 51 | 7. Poland | 81 | 6 | 6 |
| 8. Russia | 49 | 4 | -7 | 8. China | 64 | 5 | 24 |
| 9. Norway | 42 | 4 | 3 | 9. Netherlands | 50 | 4 | -38 |
| 10. Singapore | 31 | 3 | - | 10. Belarus | 47 | 4 | -1 |
Exports and imports by commodity section, January 2019
| Commodity section (chapter) by Combined Nomenclature (CN) | Exports | Imports | Balance, million euros | ||||
|---|---|---|---|---|---|---|---|
| million euros | share, % | change compared to same period of previous year, % | million euros | share, % | change compared to same period of previous year, % | ||
| TOTAL | 1,156 | 100 | 12 | 1,275 | 100 | 2 | -119 |
| Agricultural products and food preparations (I–IV) | 86 | 7 | 3 | 118 | 9 | -2 | -32 |
| Mineral products (V) | 157 | 14 | 31 | 204 | 16 | 20 | -47 |
| Raw materials and products of chemical industry (VI) | 62 | 5 | 32 | 116 | 9 | 11 | -54 |
| Articles of plastics and rubber (VII) | 35 | 3 | 5 | 67 | 5 | 6 | -32 |
| Wood and articles of wood (IX) | 132 | 11 | 17 | 42 | 3 | 2 | 90 |
| Paper and articles thereof (X) | 31 | 3 | 0 | 22 | 2 | 0 | 9 |
| Textiles and textile articles (XI) | 33 | 3 | -1 | 57 | 5 | 3 | -25 |
| Base metals and articles of base metal (XV) | 89 | 8 | 13 | 112 | 9 | 3 | -23 |
| Mechanical appliances (84) | 101 | 9 | 24 | 120 | 9 | -4 | -19 |
| Electrical equipment (85) | 197 | 17 | 15 | 180 | 14 | -7 | 16 |
| Transport equipment (XVII) | 68 | 6 | -4 | 124 | 10 | -8 | -56 |
| Optical, measuring, precision instruments (XVIII) | 34 | 3 | -13 | 31 | 2 | -5 | 3 |
| Miscellaneous manufactured articles (XX) | 93 | 8 | 0 | 32 | 3 | 5 | 62 |
| Other | 38 | 3 | -2 | 51 | 4 | -4 | -13 |


 «The Baltic Course» Is Sold and Stays in Business!
