
Analytics, Employment, Latvia, Statistics, Wages
International Internet Magazine. Baltic States news & analytics
Friday, 26.04.2024, 23:15
In 2018, 64.5% of population in Latvia were employed
 Print version
Compared to 2017, employment rate grew by 1.6 percentage points and number of employed persons by 14.6 thousand.
The most notable rise in the number of employed persons was recorded in construction, wholesale and retail trade; repair of motor vehicles and motorcycles, as well as administrative and support service activities.
Last year, 2.6 thousand of the employed persons participated in complex support activities organised by the State Employment Agency, e.g., had paid temporary community work while still having the status of unemployed.
In the 4th quarter of 2018, 909.8 thousand people aged 15–74 were employed, which is 10.3 thousand people fewer than in the 3rd quarter. Employment rate constituted 64.7 %, which is 0.6 percentage points lower than in the 3rd quarter.
Nevertheless since the 4th quarter of 2012 Latvian employment rate exceeds the European Union (EU) average (in the 3rd quarter of 2018 it constituted 60.8%), in the 4th quarter it was the lowest rate among the Baltic states – employment rate in Estonia constituted 69.1% and in Lithuania 65.4%.
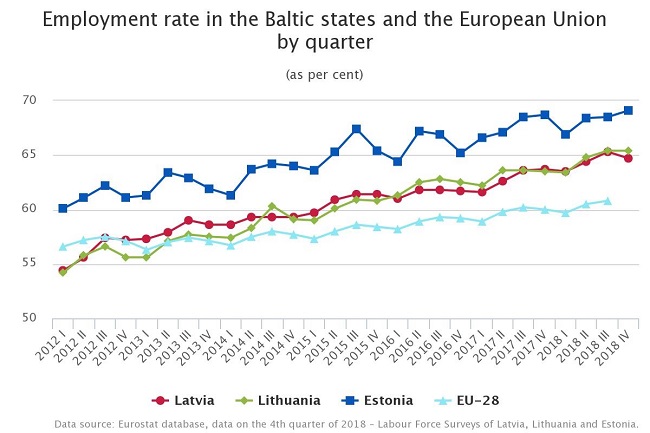
Data source: Eurostat database, data on the 4th quarter of 2018 – Labour Force Surveys of Latvia, Lithuania and Estonia.
In 2018, employment rate among young people (aged 15–24) constituted 33.1 %, which is 0.1 percentage points higher than in 2017. The number of employed young people accounted for 57.4 thousand (59.1 thousand in 2017). Compared to the 3rd quarter, in the 4th quarter the number of employed young people dropped by 9.8 thousand or 15.6 % and constituted 52.9 thousand.
Last year, persons employed in the main job worked on average 38.3 hours per week, which is the same number recorded in 2017. In the 4th quarter of 2018, persons employed in the main job worked on average 37.8 hours per week, which is 1.0 hours fewer than in the 3rd quarter.
Compared to 2017, in 2018 the share of employees receiving up to EUR 450 monthly (after taxes) fell to 30.5% (a drop of 8.7 percentage points), the proportion of employees receiving minimum monthly wage* or less accounted for 135.7 thousand or 16.9% (a reduction of 2.2 percentage points over the year). In the 4th quarter of 2018, compared to the 3rd quarter, the share of employees receiving up to EUR 450 monthly (after taxes) dropped to 27.7% (decline of 1.2 percentage points), and the proportion of employees receiving minimum monthly wage1 or less constituted 115.7 thousand or 14.3% (a reduction of 1.0 percentage points).
Compared to 2017, in 2018 the share of employees receiving EUR 450–700 monthly increased by 2.0 percentage points and constituted 34.4%, and that of employees receiving EUR 700–1400 monthly increased by 5.5 percentage points constituting 25.7%. The share of employees receiving EUR 1400–700 monthly rose by 0.7 percentage points and comprised 4.1%.
In 2018, wage or salary of 2.6% of employees was not calculated or paid, while 2.7% did not indicate the size of earnings thereof.
Employees by monthly net wages and salaries in the main job
(as %)
| 2017 | 2018 | 2018 | |||
Q1 | Q2 | Q3 | Q4 | |||
Employees | 100.0 | 100.0 | 100.0 | 100.0 | 100.0 | 100.0 |
up to EUR 450.00 | 39.2 | 30.5 | 34.9 | 30.6 | 28.9 | 27.7 |
employees receiving minimum monthly wage or less | 19.1 | 16.9 | 20.5 | 17.4 | 15.3 | 14.3 |
EUR 450.01–700.00 | 32.4 | 34.4 | 33.7 | 34.9 | 33.5 | 35.6 |
EUR 700.01-1400.00 | 20.2 | 25.7 | 22.6 | 25.3 | 27.1 | 27.9 |
EUR 1400.01 and more | 3.4 | 4.1 | 4.3 | 3.6 | 4.2 | 4.3 |
was not calculated or paid | 2.7 | 2.6 | 1.6 | 3.0 | 3.3 | 2.3 |
not specified | 2.1 | 2.7 | 2.9 | 2.6 | 3.0 | 2.2 |
In 2018, Labour Force Survey questions about economic activity were asked to 29.1 thousand people aged 15–74 living in 16.3 thousand households, while in the 4th quarter – to 7.4 thousand people aged 15–74 and living in 4.2 thousand households.


 «The Baltic Course» Is Sold and Stays in Business!
