
Analytics, Economics, Estonia, GDP
International Internet Magazine. Baltic States news & analytics
Saturday, 25.07.2026, 04:27
GDP of Estonia declined by 15.1% in Q1
 Print version
In the 1st quarter, the GDP at current prices was 52.2 billion kroons having decreased successively in nominal terms already for two quarters. In real terms the GDP decreased successively already for four quarters.
Compared to the 4th quarter of the previous year, the seasonally and working-day adjusted GDP decreased by 6.1%.
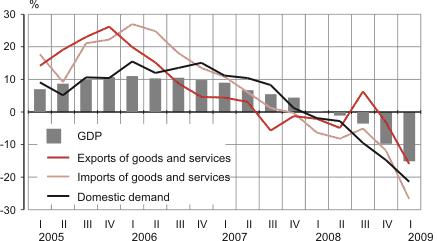
The decrease in the GDP was influenced by steeply decreased domestic and external demand. The domestic demand decreased by 21.4% compared to the 1st quarter of the previous year above all due to the substantial decrease in household final consumption expenditures, gross fixed capital formation and change in inventories. The share of the domestic demand in the GDP was 98.9%. The domestic demand at current prices was less than the GDP last 8 years ago (in the 3rd quarter of 2001).
Household final consumption expenditures decreased by 17.6%. Expenditures decreased in all expenditure groups, but the decrease in expenditures on recreation and culture, transport and miscellaneous goods and services (e.g. financial services, personal care, etc.) had the biggest effect. The gross fixed capital formation decreased by 26.6%, whereas the decrease in investments in non-financial corporations’ and households’ sectors had the biggest influence on it. By fixed assets, investments decreased in transport equipment and machinery and equipment the most. Investments in dwellings also decreased fast.
Due to the weak domestic demand, imports of goods and services decreased steeply (-26.7% in real terms). Imports of goods decreased by 28.3% and imports of services by 19.6%. The decrease in imports of motor vehicles, machinery and mechanical equipment, chemicals and chemical products had the biggest impact on the imports of goods. At the same time, imports of refined petroleum products increased. Exports of goods and services decreased by 16% due to the weak external demand. Exports of goods decreased by 18% and exports of services by 10.7%. The decrease in exports of electrical machinery and apparatus, wood and wood products and motor vehicles had the biggest influence on the exports of goods. At the same time, exports of refined petroleum products increased substantially. The decrease in exports of freight transport services of road transport and travel services influenced the exports of services the most. At the same time, exports of railway transport services increased. The share of net exports in the GDP was 1.7%. This indicator has continuously improved during the last two years. The share of net exports in the GDP was positive last in the 3rd quarter of 2000.
The value added decreased in the majority of economic activities. A steep decrease of the value added in manufacturing, construction, retail and wholesale trade and transport, storage and communications influenced the decrease of GDP the most. In manufacturing the value added decreased in all economic activities due to a continually small domestic demand and by virtue of that, the decrease in orders. Exports of the manufacturing output decreased as well due to the weak external demand. A steep decrease of the value added of construction was caused by the decrease in construction volume of dwellings in the domestic market. The decrease in value added of transport and storage was caused primarily by the decrease in the value added of road transport and support activities of transport.
The decrease of the value added in financial intermediation deepened in the 1st quarter due to the fast deceleration in the growth of financial and interest income, fees and commissions’ income.
 |
|
Real growth of the GDP, domestic demand, exports and imports of goods and services, 1st quarter 2005 – 1st quarter 2009 |
The value added increased only in fishing and electricity, gas and water supply. The contribution of these economic activities on the GDP is minor (in total 4.4% of the GDP). The increase in the value added of electricity, gas and water supply was supported by the exports of electricity to Finland and Latvia.
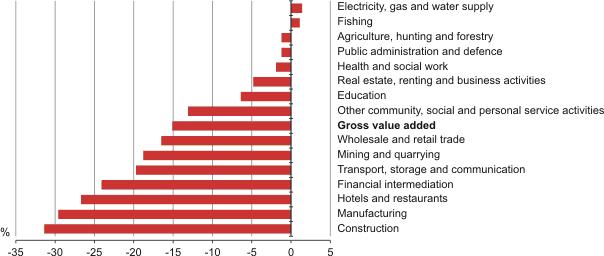 |
| Real growth of the value added of economic activities, 1st quarter 2009 |
In relation with modest production and consumption activity in real terms the net taxes on products continually decreased. However, the receipts of product taxes increased in nominal terms due to the low base in the 1st quarter of the previous year and good receipts of excise taxes.
Statistics Estonia releases regular revision of 2005–2008 based on supply and use tables and annual business reports on the 8th September. In addition, by virtue of European Union requirements Statistics Estonia revises calculations of the actual and imputed rent of dwellings since 1995 and reclassifies several units between non-financial corporations sector and general government sector since 2002. As 2008 will be revised as well, the updated data for the 1st quarter of 2009 will be published on the same date.


 «The Baltic Course» Is Sold and Stays in Business!
