
Analytics, Financial Services, Latvia, Quality of life, Society, Statistics
International Internet Magazine. Baltic States news & analytics
Sunday, 05.04.2026, 20:17
In 2017, household disposable income increased by 11.8 %
 Print version
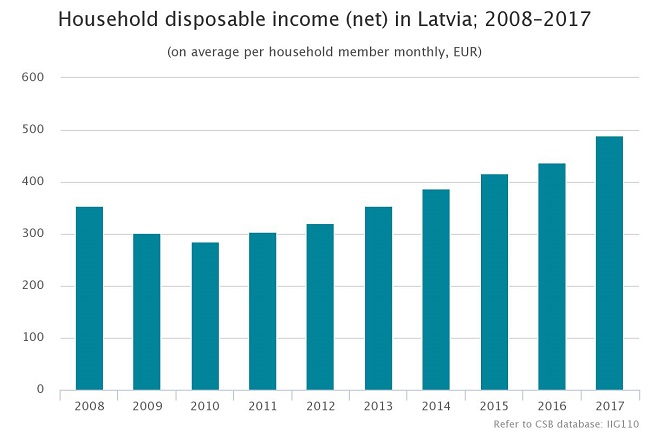
In 2017, the smallest household disposable income was in Latgale – 330 euros per household member monthly. Since 2016 household income in this region has increased by 10.3%. But the largest income was in Riga and Pierīga – 592 euros and 536 euros, respectively. In these regions household disposable income rose by 12.2%. In Zemgale household disposable income comprised 442 euros per month (increase of 14.4%), in Kurzeme – 431 euros per month (increase of 8.8%) and in Vidzeme – 401 euros per month (increase of 9.6%). In urban areas household disposable income comprised 518 euros per household member monthly (increase of 10.9%) and in rural areas – 425 euros per month (increase of 14.2%).
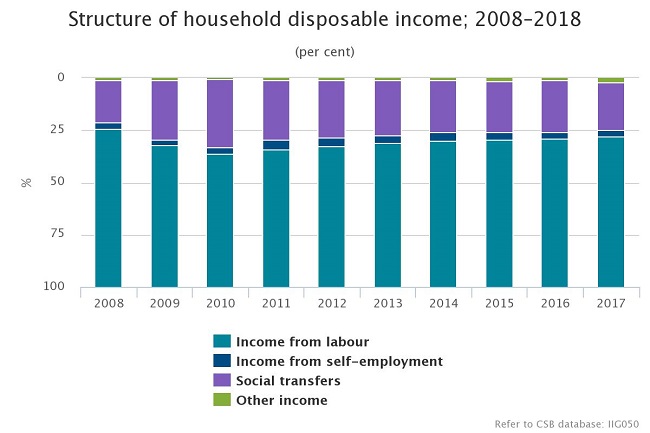
In 2017, household income from labour per household member rose by 13.1% – from 311 euros a month in 2016 to 352 euros a month in 2017. Income from social transfers2 (pensions, allowances and other budgetary payments) per household member grew slower – by 4.2% (from 108 euros a month in 2016 to 112 euros a month in 2017).
In 2017, the share of income from labour amounted to 72% of the total disposable income (71.2% in 2016), while the share of social transfers amounted to 23% (24.7% in 2016).
In 2017, compared to 2016, the lowest increase in income was observed in the poorest households (by 5.6% in households of the 1st quintile group3 and by 7.1% in households of the 2nd quintile group). The largest growth in income was recorded in households belonging to the 5th quintile group (increase of 14.3%). Over a year income in households of the 4th and 3rd quintile groups grew by 11.3% and 11.6%, respectively.
Household disposable income by quintile group; 2008–2017
(on average per household member monthly, EUR)
Quintile group | 2008 | 2009 | 2010 | 2011 | 2012 | 2013 | 2014 | 2015 | 2016 | 2017 | Income increase in 2017, compared to 2016, % |
1st (poorest households) | 112 | 100 | 97 | 105 | 112 | 125 | 135 | 150 | 154 | 162 | 5.6 |
2nd | 201 | 202 | 194 | 199 | 209 | 228 | 245 | 257 | 266 | 285 | 7.1 |
3rd | 281 | 259 | 257 | 260 | 272 | 295 | 317 | 340 | 360 | 401 | 11.6 |
4th | 411 | 355 | 338 | 352 | 372 | 413 | 449 | 483 | 514 | 572 | 11.3 |
5th (richest households) | 797 | 668 | 620 | 681 | 701 | 780 | 847 | 896 | 942 | 1076 | 14.3 |
National average | 355 | 303 | 286 | 305 | 320 | 354 | 387 | 417 | 437 | 489 | 11.8 |
In 2017 income inequality increased. The Gini coefficient of Latvia grew by one percentage point over the year (from 34.5% to 35.6 %), moreover, gap between the poorest (1st quintile group) and the richest (5th quintile group) became more obvious. In 2017 income of the richest population was 6.8 times higher than that of the poorest population (in 2016 this difference in income was 6.3 times).
Income inequality indicators, 2008 – 2017
indicator | 2008 | 2013 | 2014 | 2015 | 2016 | 2017 |
Gini coefficient4 (%) | 37.5 | 35.5 | 35.4 | 34.5 | 34.5 | 35.6 |
Quintile share ration (S80/S20)5 | 7.4 | 6.5 | 6.5 | 6.2 | 6.3 | 6.8 |
Compared to other European Union (EU) Member States6, the income inequality level in Latvia remains high. According to the latest data, the Gini coefficient of Latvia was the third highest among EU Member States. In 2016, the coefficient was higher only in Bulgaria (40.2%) and Lithuania (37.6%); the average coefficient of EU amounted to 30.3%. The quintile share ratio was also third highest in the EU. Higher quintile share ratio in 2016 was only in Bulgaria (8.2) and Lithuania (7.3), while the EU average amounted to 5.1.
Household disposable income data source: survey on income and living conditions conducted by the CSB in 2018 (EU-SILC – EU Statistics on Income and Living Conditions). The survey covered 5.8 thousand households and 10.8 thousand respondents aged 16 and over. CSB will collect data on household disposable income in 2018 within the framework of the 2019 survey.


 «The Baltic Course» Is Sold and Stays in Business!
