
Analytics, Industry, Lithuania, Statistics
International Internet Magazine. Baltic States news & analytics
Friday, 26.04.2024, 22:00
Over the month, in Lithuania industrial production increased by 1.4%
 Print version
Over the month, seasonally and calendar adjusted, an increase in
production was observed for the manufacture of refined petroleum products – 7.7%
(unadjusted – 9.1%), fabricated metal products, except machinery and equipment
– 7.1 (unadjusted – 20.2%), electrical equipment – 6.8% (unadjusted – 20.3%),
wearing apparel – 5.5% (unadjusted – 13.2%).
Table 1.
Changes in industrial production
At constant prices of 2015, growth, drop, (−),%
|
Economic activities |
August 2018, against |
|||
|
July 2018,
seasonally and calendar adjusted |
July 2018 |
August 2017, calendar adjusted |
August 2017 |
|
|
Industry (B–E) |
1.4 |
5.1 |
3.0 |
3.5 |
|
Mining and quarrying, manufacturing (B and C) |
1.8 |
5.4 |
4.0 |
4.5 |
|
Mining and
quarrying (B) |
−1.9 |
2.6 |
−7.5 |
−8.5 |
|
Manufacturing (C) |
1.8 |
5.4 |
4.2 |
4.6 |
|
Manufacturing (except for the manufacture of
refined petroleum products) (C excl. C19) |
0.3 |
4.5 |
4.8 |
4.6 |
|
Electricity, gas, steam and air conditioning
supply (D) |
−3.6 |
0.8 |
−13.6 |
−13.6 |
|
Water supply, sewerage, waste management and
remediation activities (only Division 36 of Section E – water
collection, treatment and supply) |
−2.1 |
1.9 |
3.8 |
3.4 |
|
Main industrial groupings |
|
|
|
|
|
Energy products |
4.7 |
7.2 |
0.1 |
0.7 |
|
Intermediate goods |
0.2 |
2.2 |
6.6 |
7.4 |
|
Capital goods |
−0.5 |
7.4 |
8.4 |
9.9 |
|
Consumer durables |
0.0 |
13.3 |
1.1 |
1.4 |
|
Consumer
non-durables |
0.2 |
3.6 |
−1.6 |
−0.7 |
In January–August 2018, industrial production totalled EUR 14.6 bln
at current prices, and against the same period of 2017, calendar adjusted,
increased by 5% at constant prices.
Table 2.
Changes in industrial production
At constant prices of 2015, growth, drop, (−),%
|
Economic activities |
January–August 2018, against |
|
|
January–August 2017, calendar adjusted |
January–August 2017 |
|
|
Industry (B–E) |
5.0 |
5.0 |
|
Mining and quarrying, manufacturing (B and C) |
5.4 |
5.4 |
|
Mining and
quarrying (B) |
−8.0 |
−7.8 |
|
Manufacturing (C) |
5.5 |
5.5 |
|
Manufacturing (except for the manufacture of
refined petroleum products) (C excl. C19) |
7.1 |
7.3 |
|
Electricity, gas, steam and air conditioning
supply (D) |
0.8 |
0.9 |
|
Water supply, sewerage, waste management and
remediation activities (only Division 36 of Section E – water
collection, treatment and supply) |
6.1 |
5.9 |
|
Main industrial groupings |
|
|
|
Energy products |
−0.3 |
−0.6 |
|
Intermediate goods |
9.3 |
9.5 |
|
Capital goods |
13.9 |
14.9 |
|
Consumer durables |
4.1 |
4.4 |
|
Consumer
non-durables |
0.6 |
1.0 |
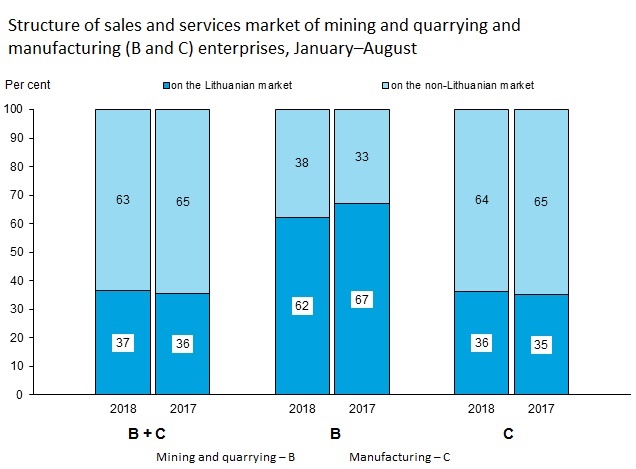
Changes in sales of mining and quarrying and manufacturing enterprises in
January–August 2018, against the same period of 2017
In January–August 2018, against the same period of 2017, the value of
sales and services of industrial enterprises on the non-Lithuanian market
increased by 8.9% at current prices. The increase was determined by an increase
in the sales of the production of the manufacture of refined petroleum products
(11.4%), furniture (12.8%), chemicals and chemical products (8.3%). Refined
petroleum products excluded, the value of sales on the non-Lithuanian market
increased by 8.2% at current prices. The value of sales to euro area countries
increased by 8.9, to non-euro area countries – 9% at current prices.
The value of sales and services of industrial enterprises on the
Lithuanian market increased by 14.4, refined petroleum products excluded – 9.9%
at current prices.


 «The Baltic Course» Is Sold and Stays in Business!
