
Analytics, Economics, GDP, Lithuania
International Internet Magazine. Baltic States news & analytics
Saturday, 25.07.2026, 04:26
GDP of Lithuania decreased by 13.6% in Q1 y-o-y
 Print version
In I quarter 2009, negative results were recorded for all market activities. The most rapid decrease was observed for the value added of construction (by 37.3%), trade, transport and communication (by 20.9%) and industry and energy (by 13.5%) activities. A slower decrease was observed for the value added of financial intermediation, real estate and business (by 7.5%) and agriculture and fishing (by 1.3%) activities.
An increase in the value added was recorded only for non-market services. The value added of public administration and defence, education, health and social work, and other community, social and personal service activities grew by 2.2%.
In January–March 2009, against the same period in 2008, consumption expenditure considerably decreased. Final consumption expenditure of households and non-profit organisations decreased by, respectively, 15.1 and 14.2%. Final consumption expenditure of the general government was higher than in I quarter 2008; therefore, their real growth rate made up 2.2%. However, a significant decrease was observed for expenditure on capital formation: gross fixed capital formation dropped by 37.1%.
A sharp decrease in consumption and capital formation conditioned a significant decrease in imports of goods and services (by 32.9%). Although exports also decreased (by 14.8%), the current account of the balance of payments for January–March 2009 was balanced.
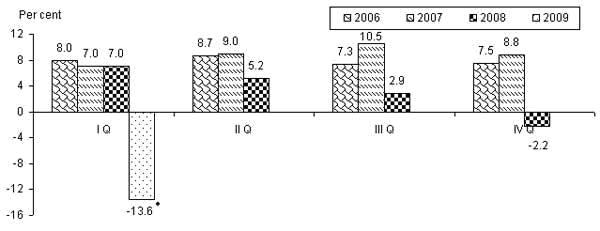 |
| Fig. 1. GDP growth rates, as compared to the corresponding period of the previous year |
Changes in Gross domestic product
|
|
At current prices |
Chain-linked volume | |||||
|
LTL million |
EUR million |
LTL million |
Changes,% |
Changes of seasonally and working day adjusted data,% | |||
|
As compared to the previous period |
As compared to the corresponding period of previous year |
As compared to the previous period |
As compared to the corresponding period of previous year | ||||
|
2006 |
82792.8 |
23978.5 |
71779.9 |
7.8 |
7.8 |
7.8 |
7.8 |
|
I |
17335.3 |
5020.6 |
15969.6 |
-9.9 |
8.0 |
1.9 |
8.6 |
|
II |
20250.7 |
5865.0 |
17625.9 |
10.4 |
8.7 |
1.7 |
8.3 |
|
III |
22205.9 |
6431.3 |
19124.8 |
8.5 |
7.3 |
1.3 |
6.9 |
|
IV |
23000.9 |
6661.5 |
19059.6 |
-0.3 |
7.5 |
2.5 |
7.7 |
|
2007◘ |
98138.7 |
28422.9 |
78186.0 |
8.9 |
8.9 |
8.9 |
8.9 |
|
I |
20222.9 |
5857.0 |
17084.5 |
-10.4 |
7.0 |
2.2 |
8.0 |
|
II |
24384.8 |
7062.3 |
19214.6 |
12.5 |
9.0 |
2.5 |
8.8 |
|
III |
26195.1 |
7586.6 |
21141.5 |
10.0 |
10.5 |
2.3 |
9.8 |
|
IV |
27335.9 |
7917.0 |
20745.4 |
-1.9 |
8.8 |
2.0 |
9.2 |
|
2008* |
111498.7 |
32292.2 |
80544.6 |
3.0 |
3.0 |
3.0 |
3.0 |
|
I |
24461.0 |
7084.4 |
18287.9 |
-11.8 |
7.0 |
0.2 |
7.0 |
|
II |
28604.2 |
8284.4 |
20211.7 |
10.5 |
5.2 |
0.2 |
4.6 |
|
III |
29854.6 |
8646.5 |
21765.0 |
7.7 |
2.9 |
-0.3 |
2.0 |
|
IV |
28578.8 |
8277.0 |
20279.9 |
-6.8 |
-2.2 |
-1.4 |
-1.3 |
|
2009* |
|
|
|
|
|
|
|
|
I¨ |
20652.5 |
5981.4 |
15796.6 |
-22.1 |
-13.6 |
-10.5 |
-11.8 |
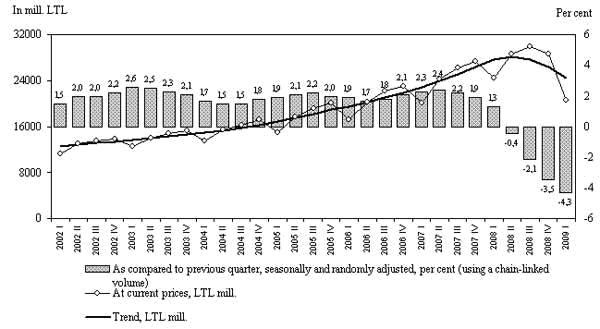 |
| Fig. 2. Changes in Gross domestic product |
¨ Second estimate. * Provisional data. ◘ Non-final data.


 «The Baltic Course» Is Sold and Stays in Business!
