
Analytics, Employment, Labour-market, Lithuania, Markets and Companies
International Internet Magazine. Baltic States news & analytics
Friday, 26.04.2024, 19:42
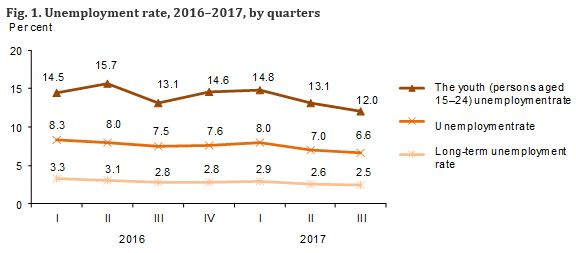
In Q3, the unemployment rate in Lithuania stood at 6.6%
 Print version
In III quarter 2017, the youth (persons aged 15–24) unemployment rate stood at 12%, and against II quarter 2017 and III quarter 2016, decreased by 1.1 percentage point.
Over a quarter, the long-term unemployment rate decreased by 0.1 percentage point and in III quarter 2017, stood at 2.5%.
In III quarter 2017, there were 95.5 thousand unemployed persons aged 15–74, of whom, 13.6 thousand – aged 15–24. Over a quarter, the number of the unemployed decreased by 6.7 thousand, of whom aged 15–24 – by 2 thousand.
Table 1. The unemployed, thousand
|
|
2017 |
III quarter 2016 |
Increase,
decrease (–), III quarter 2017, against |
|||||
|
I quarter |
II quarter |
III quarter |
II quarter 2017 |
III quarter 2016 |
||||
|
thousand |
per cent |
thousand |
per cent |
|||||
|
Total |
117.7 |
102.2 |
95.5 |
111.0 |
–6.7 |
–6.5 |
–15.5 |
–14.0 |
|
males |
73.0 |
61.9 |
54.9 |
62.5 |
–7.0 |
–11.3 |
–7.6 |
–12.1 |
|
females |
44.7 |
40.3 |
40.6 |
48.6 |
0.3 |
0.8 |
–8.0 |
–16.4 |
|
Youth (persons aged 15–24) |
17.1 |
15.5 |
13.6 |
16.7 |
–2.0 |
–12.6 |
–3.1 |
–18.8 |
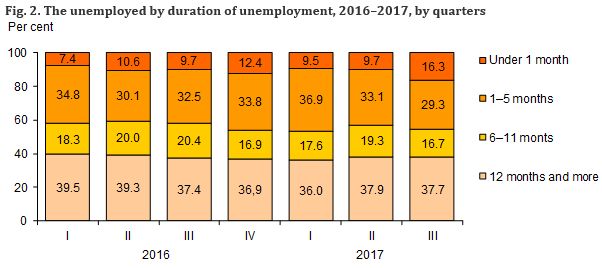
The number of the long-term unemployed was 36 thousand, or 37.7% of the total number of the unemployed. In III quarter 2017, against II quarter 2017, the number of the long-term unemployed decreased by 2.7 housand, and against the respective quarter of 2016, by 5.5 thousand.
In III quarter 2017, the employment rate of persons aged 15–64 stood at 70.9%; over a quarter, it increased by 0.3 percentage points, and over a year, by 0.9 percentage points. In the said age group, the male employment rate was by 0.7 percentage points higher than that of female (71.3 and 70.6% respectively).
In III quarter 2017, the youth (persons aged 15–24) employment rate stood at 31.1%; against II quarter 2017, it decreased by 0.5 percentage points, and against the respective quarter of 2016, by 1 percentage point.
Over a quarter, the employment rate of persons aged 55–64 decreased by 0.7 percentage points; over a year, it increased by 0.7 percentage points; in III quarter 2017, it stood at 65.5%.
Table 2. Employment rate, %
|
|
2017 |
III quarter 2016 |
Increase,
decrease (–), percentage points, III quarter 2017, against |
|
|||
|
I quarter |
II quarter |
III quarter |
|
||||
|
II quarter 2017 |
III quarter 2016 |
|
|||||
|
Aged 15–64 |
69.0 |
70.6 |
70.9 |
70.0 |
0.3 |
0.9 |
|
|
males |
69.1 |
70.5 |
71.3 |
70.9 |
0.8 |
0.4 |
|
|
females |
69.0 |
70.7 |
70.6 |
69.2 |
–0.1 |
1.4 |
|
|
Aged 15–24 |
29.3 |
31.6 |
31.1 |
32.1 |
–0.5 |
–1.0 |
|
|
Aged 20–64 |
74.7 |
76.3 |
76.3 |
75.7 |
0.0 |
0.6 |
|
|
Aged 55–64 |
65.3 |
66.2 |
65.5 |
64.8 |
–0.7 |
0.7 |
|
In III quarter 2017, the number of persons classified under the labour force totalled 1 million 454 thousand; against II quarter 2017, it decreased by 10.7 thousand.
In III quarter 2017, there were 1 million 359 thousand employed persons. Over a quarter, their number decreased by 4 thousand, over a year, by 9.9 thousand.
In III quarter 2017, there were 99.7 thousand employed persons aged 15–24. Over a quarter, their number decreased by 3.2 thousand; over a year, by 11.3 thousand.
Table 3. Economic activity of persons aged 15 and older, thousand
|
|
2017 |
III quarter 2016 |
Increase,
decrease (–) III quarter 2017, against |
|||||
|
I quarter |
II quarter |
III quarter |
II quarter 2017 |
III quarter 2016 |
||||
|
thousand |
per cent |
thousand |
per cent |
|||||
|
Labour force |
1 463.0 |
1 465.0 |
1 454.3 |
1 479.7 |
–10.7 |
–0.7 |
–25.4 |
–1.7 |
|
Employed persons |
1 345.3 |
1 362.8 |
1 358.8 |
1 368.7 |
–4.0 |
–0.3 |
–9.9 |
–0.7 |
|
males |
652.0 |
659.5 |
665.7 |
670.8 |
6.1 |
0.9 |
–5.2 |
–0.8 |
|
females |
693.3 |
703.2 |
693.1 |
697.8 |
–10.1 |
–1.4 |
–4.7 |
–0.7 |
|
Unemployed |
117.7 |
102.2 |
95.5 |
111.0 |
–6.7 |
–6.5 |
–15.5 |
–14.0 |
|
Economically inactive persons |
962.2 |
942.9 |
945.8 |
966.1 |
2.8 |
0.3 |
–20.3 |
–2.1 |
In III quarter 2017, there were 945.8 thousand economically inactive persons aged 15 and older; more than half (57.1%) of them were old-age pensioners and persons entitled to anticipatory old-age pension.
In III quarter 2017, there were 206.9 thousand (64.6%) economically inactive persons aged 15–24; 87.3% of them were studying at general, vocational schools, schools of higher education (colleges, universities).
The statistical information has been prepared based on the Labour Force Survey data. The survey is carried out in all EU Member States, using the same concepts and classifications, following the recommendations of the International Labour Organization, which makes its results comparable across the countries.
The survey has been carried using a sampling method. Over III quarter 2017, 12.6 thousand residents (0.5%) aged 15 and older were interviewed; the results were recalculated for the total population.
A news release on employment and unemployment in 2017 and IV quarter 2017 is due on 9 February 2018.
More information on the issue is available in the Database of Indicators.


 «The Baltic Course» Is Sold and Stays in Business!
