
Analytics, Industry, Lithuania, Markets and Companies
International Internet Magazine. Baltic States news & analytics
Saturday, 27.04.2024, 04:39
Prices for industrial production in Lithuania increased by 0.8% in September
 Print version
The greatest influence on the change in prices for industrial production sold by economic activity is provided in Table 1.
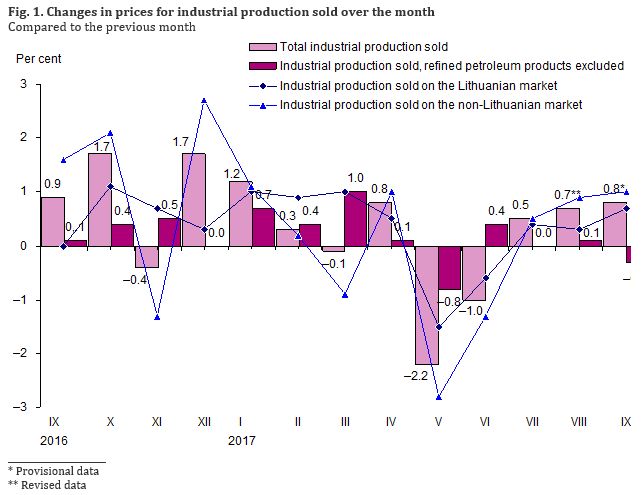
Over the month, prices for industrial production sold on the Lithuanian market increased by 0.7%, refined petroleum products excluded – decreased by 0.1%. The largest increase in prices was observed for refined petroleum products – 6.7%. The largest decrease in prices was observed for beverages – 3.5%. Among food products, an increase in prices was observed for fruit, berry and vegetable juice – 12.4, rusks and biscuits; preserved pastry goods and cakes – 5.3, poultry and other meat products – 3.6%, while oil and fats went down in price by 12.5, condiments and seasonings – 8, sugar – 5.1%.
Over the month, prices for industrial production sold on the non-Lithuanian market increased by 1%, refined petroleum products excluded – decreased by 0.4%.
Over the month, the overall price change for industrial production sold on the euro area market increased by 0.2, on the non-euro area market – 1.5%.
Table 1. The greatest influence on the monthly
(September 2017, against August) change in prices for industrial production
sold by economic activity
|
EVRK |
Economic activities |
Price growth, drop (–),% |
Influence, percentage points |
|
Total industrial production sold |
|||
|
19 |
Manufacture of
refined petroleum products |
5.4 |
+1.047 |
|
20 |
Manufacture of
chemicals and chemical products |
0.4 |
+0.038 |
|
25 |
Manufacture of
fabricated metal products, except machinery and equipment |
0.7 |
+0.019 |
|
17 |
Manufacture of paper and paper products |
0.4 |
+0.009 |
|
14 |
Manufacture of wearing apparel |
0.3 |
+0.008 |
|
16 |
Manufacture of
wood and of products of wood, except furniture |
–0.4 |
–0.020 |
|
21 |
Manufacture of
basic pharmaceutical products and pharmaceutical preparations |
–3.3 |
–0.033 |
|
10 |
Manufacture of food products |
–0.2 |
–0.040 |
|
33 |
Repair and
installation of machinery and equipment |
–2.5 |
–0.050 |
|
11 |
Manufacture of beverages |
–2.8 |
–0.083 |
|
Industrial production sold on the Lithuanian
market |
|||
|
19 |
Manufacture of
refined petroleum products |
6.7 |
+0.724 |
|
14 |
Manufacture of wearing apparel |
3.2 |
+0.072 |
|
25 |
Manufacture of
fabricated metal products, except machinery and equipment |
1.5 |
+0.041 |
|
20 |
Manufacture of
chemicals and chemical products |
0.9 |
+0.034 |
|
23 |
Manufacture of
other non-metallic mineral products |
0.9 |
+0.032 |
|
33 |
Repair and
installation of machinery and equipment, |
–0.8 |
–0.018 |
|
38 |
Waste
collection, treatment and disposal activities; materials recovery |
–3.2 |
–0.023 |
|
13 |
Manufacture of textiles |
–1.8 |
–0.024 |
|
35 |
Electricity,
gas, steam and air conditioning supply |
–0.2 |
–0.048 |
|
11 |
Manufacture of beverages |
–3.5 |
–0.200 |
|
Industrial production sold on the
non-Lithuanian market |
|||
|
19 |
Manufacture of
refined petroleum products |
5.0 |
+1.284 |
|
20 |
Manufacture of
chemicals and chemical products |
0.3 |
+0.041 |
|
38 |
Waste
collection, treatment and disposal activities; materials recovery |
3.3 |
+0.016 |
|
17 |
Manufacture of paper and paper products |
0.4 |
+0.008 |
|
24 |
Manufacture of basic metals |
2.1 |
+0.008 |
|
14 |
Manufacture of wearing apparel |
–1.5 |
–0.039 |
|
16 |
Manufacture of
wood and of products of wood, except furniture |
–1.0 |
–0.052 |
|
21 |
Manufacture of
basic pharmaceutical products and pharmaceutical preparations |
–3.5 |
–0.058 |
|
33 |
Repair and
installation of machinery and equipment, |
–4.0 |
–0.074 |
|
10 |
Manufacture of food products |
–0.6 |
–0.081 |
______________________
1 National version
of NACE Rev. 2
The overall change in prices for industrial production sold is influenced not only by the rate of change in the price of a certain product but also by the relative share (weight) of the industrial production sold within certain economic activity in the total industrial production.
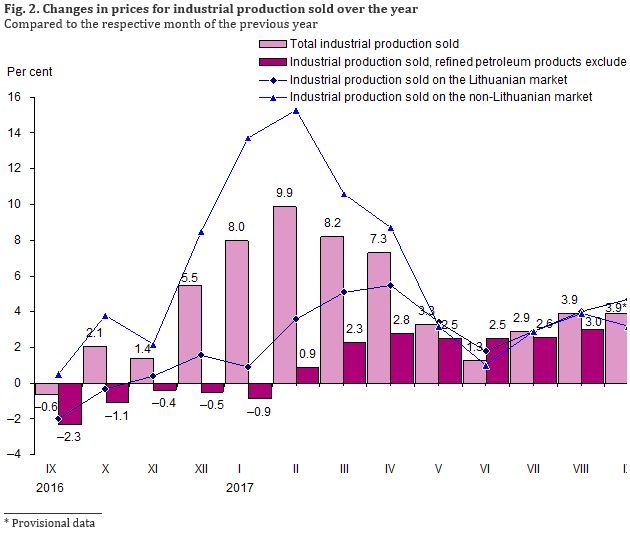
Over the year (September 2017, against September 2016), prices for the total industrial production sold increased by 3.9%, refined petroleum products excluded – 2.6%.
Over the year, prices for industrial production sold on the Lithuanian market increased by 4.7%, refined petroleum products excluded – 2.7%.
Over the year, prices for industrial production sold on the non-Lithuanian market increased by 3.2%, refined petroleum products excluded – 2.6%.
Over the year, prices for industrial production sold on the euro area market increased by 0.4, on the non-euro area market – 5.4%.
Table 2. Changes in prices for industrial production sold, September 2017
Per cent
|
Economic activity |
Relative share (weight) in total industrial
production |
Price growth, drop (–) September 2017, against |
||
|
August 2017 |
2016 |
|||
|
December |
September |
|||
|
Total industrial production sold |
100.0 |
0.8 |
0.9 |
3.9 |
|
Mining and quarrying |
0.9 |
0.3 |
–2.7 |
0.4 |
|
Manufacturing |
89.6 |
1.0 |
1.1 |
4.4 |
|
Manufacture of
refined petroleum products |
21.0 |
5.4 |
–2.2 |
9.1 |
|
Electricity,
gas, steam and air conditioning supply |
8.6 |
–0.2 |
–1.0 |
–1.8 |
|
Water supply;
sewerage, waste management and remediation activities |
0.9 |
–0.1 |
5.8 |
10.6 |
|
Total industrial production, refined petroleum products excluded |
79.0 |
–0.3 |
1.8 |
2.6 |
|
Manufacturing
production, refined petroleum products excluded |
68.6 |
–0.3 |
2.1 |
3.1 |
|
Total industrial production sold on the
Lithuanian market |
100.0 |
0.7 |
2.6 |
4.7 |
|
Mining and quarrying |
1.5 |
0.3 |
–2.5 |
1.1 |
|
Manufacturing |
76.4 |
0.9 |
3.7 |
6.6 |
|
Manufacture of
refined petroleum products |
11.3 |
6.7 |
4.2 |
24.6 |
|
Electricity,
gas, steam and air conditioning supply |
20.6 |
–0.2 |
–1.0 |
–1.8 |
|
Water supply;
sewerage, waste management and remediation activities |
1.5 |
–1.5 |
5.0 |
9.6 |
|
Total industrial production sold on the
Lithuanian market, refined petroleum products excluded |
88.7 |
–0.1 |
2.5 |
2.7 |
|
Manufacturing
production, refined petroleum products excluded |
65.1 |
0.0 |
3.6 |
4.0 |
|
Total industrial production sold on the
non-Lithuanian market |
100.0 |
1.0 |
–0.3 |
3.2 |
|
Mining and quarrying |
0.5 |
0.3 |
–3.2 |
–0.8 |
|
Manufacturing |
99.0 |
1.0 |
–0.3 |
3.2 |
|
Manufacture of
refined petroleum products |
27.8 |
5.0 |
–4.1 |
5.1 |
|
Electricity,
gas, steam and air conditioning supply |
- |
- |
- |
- |
|
Water supply;
sewerage, waste management and remediation activities |
0.5 |
3.3 |
7.9 |
12.8 |
|
Total industrial production sold on the
non-Lithuanian market, refined petroleum products excluded |
72.2 |
–0.4 |
1.1 |
2.6 |
|
Manufacturing
production, refined petroleum products excluded |
71.2 |
–0.4 |
1.1 |
2.6 |
|
Total
industrial production sold on the euro area market |
100.0 |
0.2 |
–1.6 |
0.4 |
|
Total
industrial production sold on the non-euro area market |
100.0 |
1.5 |
0.6 |
5.4 |
- Such a phenomenon (indicator) was not observed during the respective period.
For more information on the issue, please see the Database of Indicators.


 «The Baltic Course» Is Sold and Stays in Business!
