
Analytics, Employment, Labour-market, Latvia, Markets and Companies
International Internet Magazine. Baltic States news & analytics
Friday, 26.04.2024, 16:38
Number of occupied posts went up by 9.3 thousand in Latvia in H1
 Print version
At the end of
the first half of 2017, there were 17.6 thousand job vacancies in Latvia;
compared to the end of the corresponding period a year ago, the number thereof
has grown by 2.3 thousand. At the end of the first half of 2017, the
number of job vacancies constituted 6.1 thousand in public sector and 11.4 thousand
in private sector. Out of the total number of jobs in the country, 1.9%
were vacant, 2.1% of which in public sector and 1.8% in private sector. The
highest job vacancy rate was recorded among craft and related trades
workers (2.7%) and among technicians and associate professionals (2.2%).
Occupied posts and job
vacancies by sector
|
|
End of Q2 2016, thsd |
End of Q1 2017, thsd |
End of Q2 2017, thsd |
Changes of the end of
Q2 2017 (%) |
|
|
|
compared to Q2 2016 |
compared to Q1 2017 |
|||
|
Job
vacancies |
|
|
|
|
|
|
Total |
15.3 |
15.9 |
17.6 |
15.2 |
10.2 |
|
private
sector |
9.5 |
10.1 |
11.4 |
19.7 |
12.7 |
|
public
sector |
5.7 |
5.8 |
6.1 |
7.6 |
5.9 |
|
Occupied
posts |
|
|
|
|
|
|
Total |
893.9 |
881.0 |
903.2 |
1.0 |
2.5 |
|
private
sector |
605.1 |
591.8 |
612.2 |
1.2 |
3.4 |
|
public
sector |
288.7 |
289.2 |
291.0 |
0.8 |
0.6 |
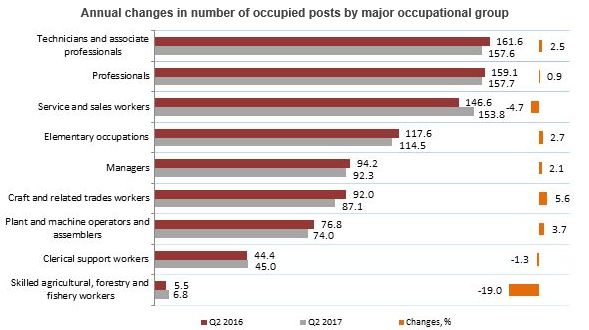
Over the year,
the number of occupied posts amongst craft and related trades workers grew by
5.6%, among plant and machine operators and assemblers by 3.7%, among
elementary occupations by 2.7%, among technicians and associate professionals
by 2.5%, among managers by 2.1%, and among professionals by 0.9%. Reduction, in
its turn, was observed in the number of skilled agricultural, forestry and
fishery workers (of 19.0%), service and sales workers (4.7%), as well as
clerical support workers (of 1.3%).
The most notable
increase in the number of occupied posts was recorded in information and
communication sector (of 6.0% or 1.8 thousand), construction (5.2% or
2.9 thousand), public administration and defence (3.1% or
2.0 thousand), accommodation and food service activities (2.9% or
1.0 thousand), and electricity, gas, steam and air conditioning supply
(1.9% or 0.2 thousand). The sharpest reduction in the number of occupied
posts, in turn, was registered in other service activities (of 3.8% or
0.6 thousand), wholesale and retail trade (1.1% or 1.6 thousand),
real estate activities (0.9% or 0.3 thousand), and professional,
scientific and technical activities (0.6% or 0.2 thousand).
At the end of
the 2nd quarter of 2017, the highest job vacancy rate was
recorded in public administration and defence (4.7%), transportation and
storage (2.3%), mining and quarrying, construction and human health and social
work activities (2.2% in each of the three sectors).
Among the
regions of Latvia, the highest job vacancy rate was observed in Riga (2.4% or
12.3 thousand of all jobs in the regions), whereas the lowest – in Kurzeme
(0.9% or 0.7 thousand).
Job vacancies and occupied
posts by main kind of economic activity
|
|
End of Q2 2016 |
End of Q2 2017 |
||||
|
Job
vacancies, thsd |
Occupied
posts, thsd |
Job
vacancy rate,% |
Job
vacancies, thsd |
Occupied
posts, thsd |
Job
vacancy rate,% |
|
|
Total |
15.3 |
893.9 |
1.7 |
17.6 |
903.2 |
1.9 |
|
Agriculture, forestry and fishing (A) |
0.2 |
22.4 |
0.9 |
0.3 |
22.8 |
1.3 |
|
Mining and
quarrying (B) |
0.0 |
3.5 |
0.2 |
0.1 |
3.6 |
1.9 |
|
Manufacturing
(C) |
2.4 |
112.1 |
2.1 |
2.6 |
112.5 |
2.2 |
|
Electricity, gas, steam and air conditioning supply (D) |
0.1 |
12.8 |
1.1 |
0.2 |
13.1 |
1.5 |
|
Water supply; sewerage, waste management and remediation activities (E) |
0.1 |
7.9 |
1.5 |
0.2 |
8.0 |
2.0 |
|
Construction
(F) |
0.9 |
56.0 |
1.6 |
1.3 |
58.9 |
2.2 |
|
Wholesale and retail trade; repair of motor vehicles and motorcycles (G) |
2.1 |
148.8 |
1.4 |
2.6 |
147.2 |
1.8 |
|
Transportation
and storage (H) |
1.2 |
77.1 |
1.5 |
1.8 |
77.9 |
2.3 |
|
Accommodation and food service activities (I) |
1.0 |
33.3 |
2.8 |
0.6 |
34.3 |
1.6 |
|
Information
and communication (J) |
0.6 |
30.1 |
1.9 |
0.5 |
31.9 |
1.7 |
|
Financial and insurance activities (K) |
0.4 |
18.3 |
2.0 |
0.3 |
18.3 |
1.8 |
|
Real
estate activities (L) |
0.3 |
27.7 |
1.1 |
0.3 |
27.4 |
1.1 |
|
Professional, scientific and technical activities (M) |
0.3 |
40.9 |
0.7 |
0.3 |
40.7 |
0.6 |
|
Administrative and support service activities (N) |
0.5 |
38.1 |
1.3 |
0.7 |
38.2 |
1.8 |
|
Public administration and defence, compulsory social security (O) |
2.8 |
63.4 |
4.2 |
3.2 |
65.4 |
4.7 |
|
Education
(P) |
0.8 |
96.5 |
0.9 |
0.7 |
97.5 |
0.7 |
|
Human health and social work activities (Q) |
1.4 |
65.3 |
2.0 |
1.5 |
66.3 |
2.2 |
|
Arts, entertainment and recreation (R) |
0.1 |
24.6 |
0.5 |
0.2 |
24.8 |
0.9 |
|
Other
service activities (S) |
0.1 |
14.9 |
0.8 |
0.1 |
14.4 |
0.7 |
Absolute changes and
percentage changes are calculated from the data not converted into thousands.
More information
on occupied posts and job vacancies in Latvia is available in the CSB website
section Occupied Posts and Job
Vacancies, Paid Working Hours – Key Indicators. Statistics on occupied posts and job vacancies in 2016 and 2nd quarter of
2017 are published in the database section Occupied Posts and Job Vacancies,
Paid Working Hours (Short term statistical
data and Annual statistical
data).
Methodological explanations
In accordance with the survey
methodology, job vacancy is defined as a post, for which no contract has been
signed and no candidate chosen, and the employer is taking active steps to find
a suitable candidate from outside the enterprise, and which will be filled
immediately or within the nearest time. The job vacancy rate is calculated in
per cent, by dividing the number of job vacancies by the total number of posts
(occupied + vacant).
Data on occupied posts and job
vacancies are acquired from the quarterly statistical reports on the activities
of businesses, individual merchants, state and local government budgetary
institutions, foundations, associations and funds, as well as from
administrative data sources. Only those peasant and fisherman farms employing
50 and more employees are included.
Private sector includes
commercial companies with central or local government capital participation of
up to 50%, commercial companies of all types without central or local
government capital participation, individual merchants, and agricultural
holdings and fishermen farms employing with 50 and more persons.
Public sector includes central
and local government institutions and commercial companies with central or
local government capital participation 50% and more, public organisations and
commercial companies thereof.


 «The Baltic Course» Is Sold and Stays in Business!
