
Analytics, Estonia, Inflation, Markets and Companies
International Internet Magazine. Baltic States news & analytics
Saturday, 27.04.2024, 00:18
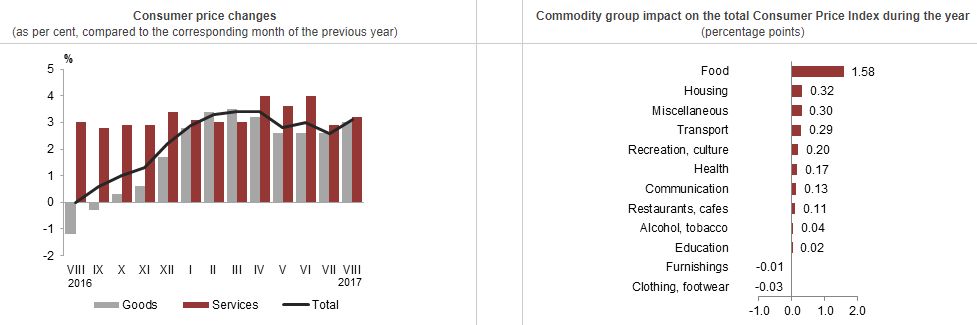
The annual inflation in Latvia made 3.1% in August
 Print version
Compared to August 2016, in
August 2017 the greatest pressure on the price changes was put by the rise in
prices of food and non-alcoholic beverages, goods and services related to
housing, prices in miscellaneous goods and services group, prices of goods and
services related to transport, prices in recreation and culture group, as well
as prices of health care.
The average level of food and
non-alcoholic beverage prices increased by 6.8%. Rise was recorded in
prices of meat and meat products, milk products, butter, milk, cheese and curd,
eggs, fresh vegetables, potatoes, fresh fruit, chocolate, and bakery products.
Prices of goods and services
related to housing grew by 2.1%. Increase was observed in prices of heat
energy, natural gas, solid fuels, refuse collection, as well as services for
the maintenance and repair of the dwelling, whereas decline was recorded in
prices of materials for the maintenance and repair of the dwelling.
Within the health care group,
the average level of prices went up by 2.9%, which was mainly influenced by the
rise in prices of pharmaceutical products, dental services, as well as prices
in medical specialist practice.
Prices of goods and services
related to transport increased by 2.2%, which was mainly affected by the rise
in prices of fuels for transport (of 4.2%). Increase was recorded also in
prices of maintenance and repair of personal transport equipment, second-hand
motor cars. Prices of passenger transport by air and passenger transport by
road, in its turn, went down.
In the recreation and culture
group, the average level of prices grew by 2.3%, which was influenced by the
rise in prices of package holidays.
Within the miscellaneous goods
and services group, the average level of prices grew by 5.6%, which was mostly
due to the influence exerted by the rise in prices of motor vehicle insurance.
Rise was registered also in prices of articles for personal hygiene and beauty
products as well as prices of financial services.
Among other commodity groups,
the most significant growth was recorded in prices of tobacco products,
telecommunication services, and catering services. Decline, in turn, was
observed in prices of spirits and footwear.
Compared to July 2017, in
August 2017 the average level of consumer prices decreased by 0.2%. Prices of
goods fell by 0.6%, while prices of services grew by 0.6%.
In August, the greatest
pressure on the consumer price changes was put by the decline in prices of food
and non-alcoholic beverages, alcoholic beverages and tobacco products, prices
in miscellaneous goods and services group, as well as by the growth in prices
of clothing and footwear, and prices in recreation and culture group.
Over the month, prices of food
and non-alcoholic beverages fell by 1.5%. Decline was recorded in prices
of fresh vegetables, potatoes, dried, salted or smoked meat, fresh fruit,
sugar, and fresh or chilled fish. Increase, in its turn, was observed in prices
of butter, cheese and curd, poultry, meat products, and milk.
Prices of alcoholic beverages
and tobacco products went down by 1.6%. Under the influence of sales campaigns,
the most significant reduction was recorded in prices of spirits and beer. The
average level of tobacco product prices went up by 0.2%.
During the month, the average
level of garment prices rose by 4.4%, and that of footwear prices fell by 0.8%.
In the recreation and culture
group, prices increased on average by 1.0%, which was mainly affected by the
rise in prices of package holidays.
Within the miscellaneous goods
and services group, the average level of prices declined by 1.0%. Due to the
discounts, articles for personal hygiene and beauty products became cheaper.
Prices of motor vehicle insurance, in turn, rose.
Among other commodity groups,
the most notable decrease was recorded in prices of non-electric kitchen
utensils and articles as well as prices of passenger transport by sea.
Increase, in turn, was registered in prices of passenger transport by air, pet
food and fuels for transport.
|
Consumer price changes by commodity group,% |
|
Goods and services having the greatest impact
on consumer price changes, percentage points |
|||||||||||||||||||||||||||||||||||||||||||||||||||||||||||||||||||||||||||||||||||||||||||||||
|
|
|
|||||||||||||||||||||||||||||||||||||||||||||||||||||||||||||||||||||||||||||||||||||||||||||||
Information on consumer price
changes in September 2017 will be published on 9 October.
More detailed information on
consumer price changes is available in the CSB database section Consumer Prices.
*The annual inflation reflects consumer price changes, comparing the average
price level in the comparison month with the average price level in the
corresponding month of the previous year.


 «The Baltic Course» Is Sold and Stays in Business!
