
Analytics, Energy, EU – Baltic States, Latvia, Markets and Companies
International Internet Magazine. Baltic States news & analytics
Friday, 26.04.2024, 22:47
Consumption of renewables in Latvia gone up by 14.1% over the past decade
 Print version
As the gross consumption of renewable resources (mainly formed by
domestic energy resources) increased, Latvian dependence1 upon
imported energy resources reduced – from 66.7% in 2006 to 51.2%
in 2015.
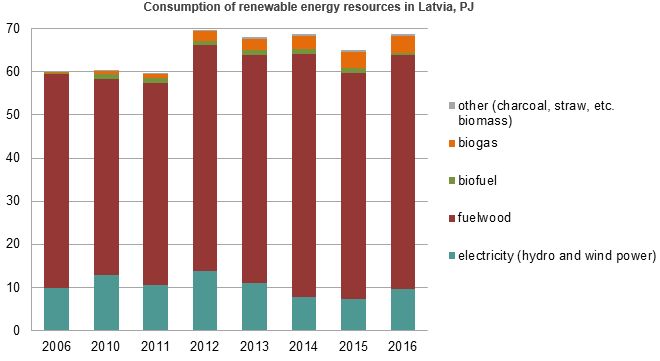
Significant
increase was recorded in consumption of biogas (landfill gas, sewage sludge
gas, other biogas) – 12.7 times during the decade, reaching 3.8 PJ in
2016.
Over the decade,
the gross consumption of fuelwood has increased by 9.3%, reaching 54.3 PJ
in 2016, whereas compared to 2015 it has gone up by 3.2%. In 2016, the share of
fuelwood in the gross energy consumption accounted for 29.4%, which is
0.8 percentage points more than in 2015. In the same time, the exports of
fuelwood rose. In 2016, Latvia exported 37.9 PJ of fuelwood, which
is 12.6% more than in 2015. Wood pellets constituted 29.3 PJ of the total
volume of fuelwood exported in 2016, which is 4.7% more than in 2015, whereas
the volume of wood chips exported rose by 79.4%.
The highest
consumption of fuelwood still was recorded in household sector, however it has
declined by 41.6% during the decade, constituting 34.6% of the gross
consumption of fuelwood in 2016. Compared to 2006, in 2016 the volume of
fuelwood consumed in industry and construction has risen 2.7 times (last
year, fuelwood consumption in the sectors constituted 25.4% of the gross
fuelwood consumption).
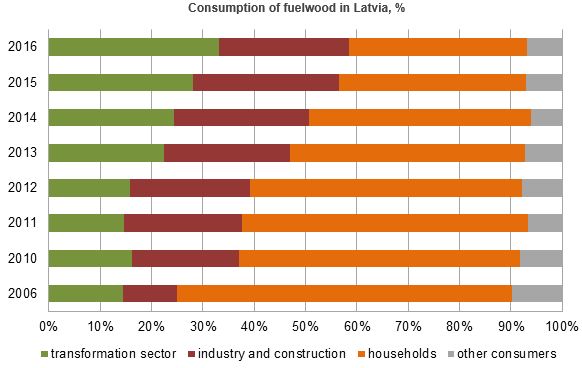
During the
decade, the share of renewable resources consumed for the production of
electricity and heat in transformation sector has grown by 18.6 percentage
points, in 2016 reaching 33.1% of the gross consumption in this sector.
Compared to 2015, the consumption of fuelwood in transformation sector has gone
up by 22.0%. From 2006 to 2016, fuelwood consumption in transformation
sector has risen 2.5 times, reaching 18.0 PJ last year. The largest
share (88.2%) of the consumed fuelwood is taken by wood chips that reached
15.9 PJ in 2016. It may be explained by the growing number of combined
heat and power (CHP) plants and share of renewable sources in the
transformation sector and reduction of the share of natural gas.
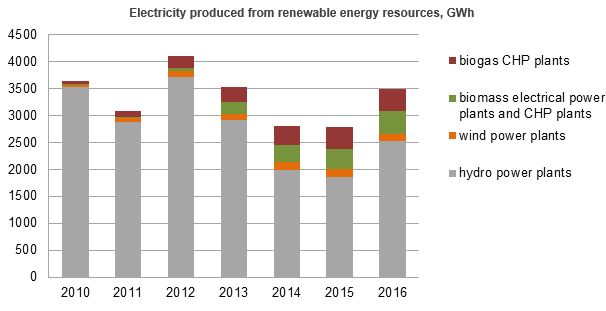
In 2016,
3 482 GWh of electricity were produced from the renewable resources, and,
compared to 2015, the volume has risen by 25.4%. In 2016, due to the
higher inflow of rivers the volume of electricity produced in hydro power
plants constituted 2 530 HGh – 36.0% more than in 2015. Over the
decade, the volume of electricity produced in wind power plants has increased
from 46 to 128 GWh or 178.3%, the volume produced in biomass electrical
power plants and CHP plants has risen from 7 to 427 GWh, and the volume
produced in biogas CHP plants – from 36 to 397 GWh.
Directive
2009/28/EC of the European Parliament and of the Council on promotion of the
use of energy from renewable sources stipulated that the share of renewable
sources in gross energy consumption in 2020 should comprise 40%. Latvia has the
third highest share of renewables in the energy consumption in the European
Union (the highest share was recorded in Sweden (53.9%) and the second largest
in Finland (39,3%)); in 2015, Latvian indicator constituted 37.6% (EU average –
16.7%). Moreover, State in 2020 each Member should ensure that the share of
energy from renewable sources (biofuel, biogas, electricity produced from
renewable sources and consumed in transport) comprises at least 10% of the
final energy consumption in transport (in 2015 Latvia reached 3.9%).
More information
on energy sector, including on renewable energy resources, is available in the
CSB website section Energy – Key
Indicators.
[1] Energy dependence is
calculated as follows: net energy imports (imports minus exports) divided by
gross inland energy consumption plus fuel supplied to international maritime
bunkers.


 «The Baltic Course» Is Sold and Stays in Business!
