
Analytics, Lithuania, Markets and Companies, Retail
International Internet Magazine. Baltic States news & analytics
Friday, 26.04.2024, 05:04
The turnover of retail trade enterprises in Lithuania decreased by 1.7% in June
 Print version
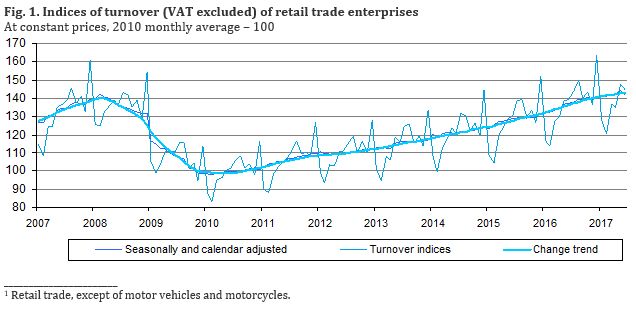
Over the month, the turnover of enterprises trading in food products, seasonally and calendar adjusted, decreased by 1.2, of those trading in non-food products – 1.5, of those engaged in retail trade of automotive fuel – 2.7% at constant prices.
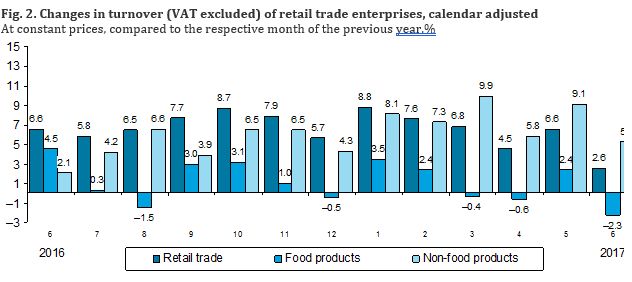
In June 2017, against June 2016, the turnover (VAT excluded) of retail trade enterprises, calendar adjusted, increased by 2.6% at constant prices (unadjusted – by 3.4%). The turnover of enterprises trading in food products, calendar adjusted, decreased by 2.3%, of those trading in non-food products – increased by 5.3%, of those engaged in retail trade of automotive fuel – increased by 6.8% at constant prices.
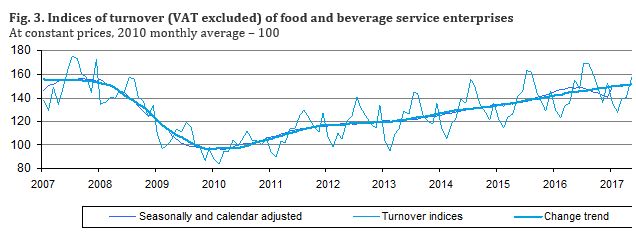
In June 2017, the turnover of enterprises engaged in food and
beverage service activities (VAT excluded) amounted to EUR 54.6
million at current prices and, against May 2017, seasonally and calendar
adjusted, increased by 0.2% at constant prices (unadjusted – decreased by 1.9%).
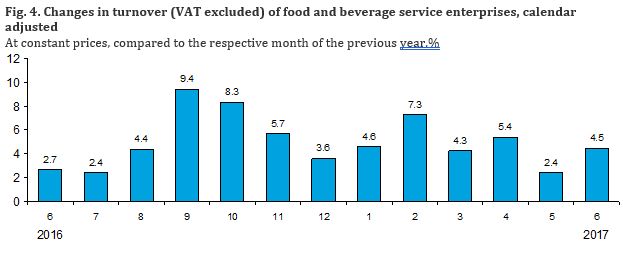
Against June 2016, calendar adjusted, the turnover of such enterprises
increased by 4.5% at constant prices (unadjusted – by 4.5% as well).
Changes in turnover (VAT excluded), at constant prices, %
|
Economic activities (NACE Rev. 2) |
June 2017, against |
January–June 2017 |
||||
|
May 2017, seasonally and calendar adjusted |
May 2017 |
June 2016, calendar adjusted |
June 2016 |
January–June 2016, calendar adjusted |
January–June 2016 |
|
|
Division 47. Retail trade1 |
–1.7 |
–2.4 |
2.6 |
3.4 |
6.0 |
6.1 |
|
Retail trade,
except for sale of automotive fuel |
–1.4 |
–2.5 |
1.3 |
2.2 |
4.0 |
3.9 |
|
Food,
alcoholic beverages and tobacco |
–1.2 |
–0.7 |
–2.3 |
–2.5 |
0.7 |
0.1 |
|
In non-specialised stores |
–1.2 |
–0.6 |
–2.4 |
–2.6 |
0.7 |
0.0 |
|
In specialised stores |
1.1 |
–2.6 |
2.9 |
5.3 |
1.9 |
2.7 |
|
Non-food products |
–1.5 |
–4.3 |
5.3 |
7.3 |
7.6 |
8.0 |
|
in specialised stores |
|
|
|
|
|
|
|
Textiles, clothing and footwear |
0.7 |
–7.4 |
6.2 |
7.7 |
6.5 |
5.9 |
|
Audio and
video equipment, recordings, metal articles, paints and glass, electrical
household appliances, furniture and lighting equipment |
–2.3 |
0.1 |
3.6 |
6.0 |
8.1 |
8.5 |
|
Information
and communication equipment, cultural and recreation goods, watches,
jewellery and other new goods |
–3.2 |
–7.4 |
2.0 |
4.6 |
7.0 |
7.7 |
|
Pharmaceuticals
and medical goods and cosmetics |
–1.0 |
–5.2 |
1.7 |
2.8 |
1.0 |
1.7 |
|
Retail sale
via mail order houses or via Internet |
0.4 |
–8.6 |
32.9 |
34.1 |
27.5 |
28.5 |
|
In non-specialised stores |
–2.9 |
–0.3 |
27.2 |
26.3 |
37.3 |
36.2 |
|
Retail sale of
automotive fuel |
–2.7 |
–2.1 |
6.8 |
7.7 |
13.3 |
14.1 |
|
Division 56. Food and beverage service
activities |
0.2 |
–1.9 |
4.5 |
4.5 |
4.6 |
4.0 |
For more information, see the Database of Indicators.


 «The Baltic Course» Is Sold and Stays in Business!
