Agriculture, Analytics, Latvia, Statistics
International Internet Magazine. Baltic States news & analytics
Saturday, 27.04.2024, 06:16
Increase recorded in output of livestock products in Latvia
 Print version
 |
|---|
In 2016, 87.2 thousand tons of meat were produced in Latvia, which is 2% more than in 2015. Out of the total meat produced, 42.5% were produced in Pierīga region, and, compared to 2015, the indicator has grown by 11.8%. The most significant increase was observed in the output of mutton and goat meat – of 8.3%, as well as output of beef and veal – of 3.7%. The production of pork and poultry meat grew by 1.1% and 1.8%, respectively. The output of other meat, including rabbit and horse meat, went up by 2.8%. Last year, egg production grew by 7.2%, reaching 748.4 million eggs.
Output of livestock products
| 2015 | 2016 (provisional data) | Changes (2016/2015), % |
Meat (slaughter weight), thsd t | 85.4 | 87.2 | 2.0 |
beef and veal | 18.8 | 19.5 | 3.7 |
pork | 35.9 | 36.4 | 1.1 |
mutton and goat | 0.9 | 0.9 | 8.3 |
poultry | 29.7 | 30.2 | 1.8 |
other meat | 0.2 | 0.2 | 2.8 |
Milk (incl. goat milk), thsd t | 978.1 | 986.2 | 0.8 |
Eggs, mln pieces | 698.2 | 748.4 | 7.2 |
The average purchase prices of milk rose from 1 456 euros per ton in 2015 to 1 492 euros per ton in 2016 or by 2.5%. The sharpest increase was observed in the purchase prices of pork (of 7.2%, reaching 1 406 euros per ton), followed by mutton (of 1.2%, reaching 3 358 euros per ton). The average purchase prices of beef and veal, in its turn, fell from 1 643 euros per ton in 2015 to 1 599 euros per ton in 2016 or by 2.7 %.
Milk output did not change notably, while milk purchase prices dropped by 0.7%
In 2016, 986.2 thousand tons of milk (incl. goat milk) were produced, which is 8.1 thousand tons or 0.8% more than in 2015, nevertheless the number of dairy cows declined 8.4 thousand or 5.2%. The total increase in the milk output was affected by the rise in milk yield per dairy cow – by 277 kg or 4.7%, reaching 6 182 kg annually.
Over the three recent years, the number of dairy cows has reduced in all regions. The sharpest drop was registered in Zemgale region – of 2.9 thousand or 9%, compared to the end of 2015 – leading to the decline in milk output of the region of 4.6 thousand tons or 2.2%.
However, due to the increase in average milk yield per dairy cow (of 5.2%), the most significant milk output rise was registered in Vidzeme region – of 7.3 thousand tons or 3.2%, compared to 2015.
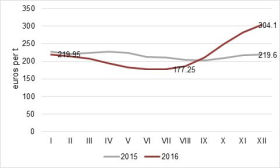
Last year, 814.0 thousand tons or milk were purchased. Compared to 2015, the milk purchase has risen by 0.8%, while the share of milk purchased in the total volume of milk produced did not change and comprised 82.8%. The average purchase price for milk fell by 0.7% – from 216 euros per ton in 2015 to 215 euros per ton in 2016. The lowest milk purchase price was recorded in July – 177 euros per ton, however as of August a sharp price rise was observed, reaching 304 euros per ton in December. Regardless fluctuations in the milk purchase prices in 2016, the average purchase price of milk was equal to that recorded in 2015.
Milk purchase price by month

* Data source of the information is Milk Producer Register information of the Agricultural Data Centre.
Decline in cattle number, whereas increase in sheep number
At the end of 2016, agricultural holdings were breeding 412.3 thousand cattle, which is 6.8 thousand or 1.6% less than in 2015; the drop was due to the reduction in the number of dairy cows of 5.2%. In 2016, the number of exported live cattle increased by 0.4 thousand or 1.1%, as compared to 2015. Calves aged under 8 months constituted 41.7% of the total number of cattle exported (45.6% in 2015).
Number of livestock* at the end of the year (thousand)
| 2015 | 2016 (provisional data) | Changes (2016/2015), % |
Cattle | 419.1 | 412.3 | -1.6 |
of which dairy cows | 162.4 | 154.0 | -5.2 |
Pigs | 334.2 | 336.4 | 0.7 |
Sheep | 102.3 | 106.6 | 4.3 |
Goats | 12.7 | 13.2 | 3.8 |
Horses | 9.6 | 9.3 | -3.3 |
Over the year, the number of pigs increased by 2.2 thousand or 0.7%. Compared to 2015, the exports of live pigs decreased by 11.9 thousand or 7%. Out of the total number of pigs exported, piglets for fattening constituted 59.4% (27.8% in 2015). The number of imported pigs, in its turn, rose 2.7 times.
Over the 10 recent years, the number of sheep has increased two times – from 53.9 thousand in 2007 to 106.6 thousand in 2016. Compared to the end of 2015, the number of sheep has risen by 4.3%.
During the 17 recent years, the number of horses, in its turn, has declined two times – in 2000 there were 19.9 thousand horses and in 2016 – 9.3 thousand horses.


 «The Baltic Course» Is Sold and Stays in Business!

