Analytics, Financial Services, Latvia, Society, Statistics
International Internet Magazine. Baltic States news & analytics
Saturday, 27.04.2024, 03:13
In 2015 Latvian household disposable income rose by 7.6%
 Print version
 |
|---|
Household disposable income (net) in Latvia; 2008–2015
(on average per household member monthly, euros)

In 2015, household disposable income in urban areas increased by 8%, reaching 448 euros monthly. In rural areas the indicator rose by 6.7% and reached 349 euros monthly. Regional breakdown indicates notable differences in monthly household income per household member. The highest income were registered in Riga; the income received by Riga residents exceeded that received by the residents of the poorest region Latgale by 79%.
The most significant rise in the household disposable income was observed in Zemgale region – of 11.2% (368 euros monthly), while the lowest in Pierīga region – of 5% (446 euros monthly). Income rise in other regions was roughly even – 8.5% in Latgale (284 euros monthly), 8.3% in Kurzeme (389 euros monthly), 7.6% in Riga (509 euros monthly), and 6.5% in Vidzeme (343 euros monthly).
Household disposable income: increase and divergence from national average in regions, urban and rural areas
| 2014 | 2015 | Income increase in 2015, compared to 2014 (%) | Divergence from average income in Latvia in 2015, % (national average income = 100 %) |
(average per household member monthly, euros) | ||||
Average in Latvia | 387 | 417 | 7.6 | 100 |
Urban areas | 415 | 448 | 8.0 | 108 |
Rural areas | 327 | 349 | 6.7 | 84 |
Riga | 473 | 509 | 7.6 | 122 |
Pierīga | 424 | 446 | 5.0 | 107 |
Vidzeme | 322 | 343 | 6.5 | 82 |
Kurzeme | 359 | 389 | 8.3 | 93 |
Zemgale | 331 | 368 | 11.2 | 88 |
Latgale | 261 | 284 | 8.5 | 68 |
In 2015, the household income from labour rose by 8 % – in 2014 the indicator constituted on average 272 euros per household member monthly, while in 2015 – 293 euros. The income from social transfers2(pensions, allowances and other payments from budget) grew slower – by 5.5% per household member monthly or from 96 euros per household member monthly in 2014 to 101 euros in 2015. The size of allowances related to family and children increased by approximately one third in 2015. The rise was mainly due to the deregulation of maternity, paternity and parental benefit payment limits, changes in requirements for granting childcare benefit as from the 1 October 2014, as well as increase of the family state allowance, as from 2015 the size of which is based on the number of children in family.
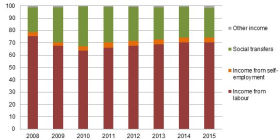
Over the five years, the share of social transfers in the household disposable income reduced by 8.1 percentage points – from 32.4% in 2010 to 24.3% in 2015 (24.8% in 2014). The share of income from labour, in turn, grew from 63.7% in 2010 to 70.4% in 2014 (70.2% in 2014). However, the level reached during the pre-crisis period, when income from labour accounted for 75.5% of the total disposable income, while income from social transfers only for 20%, still is not reached.
Structure of household disposable income, 2008–2015
(per cent)

The data source used for the household disposable income statistics is thesurvey EU Statistics on Income and Living Conditions (EU-SILC) conducted by the CSB in 2016. The survey covered 6 thousand households, and 11.6 thousand respondents aged 16 and over were interviewed. The CSB will collect the data on the household income received in 2016 during the period from February to June 2017, and respondents will be able to complete electronic questionnaire online.


 «The Baltic Course» Is Sold and Stays in Business!

