
Analytics, Estonia, GDP, Statistics
International Internet Magazine. Baltic States news & analytics
Friday, 26.04.2024, 22:12
Economy grew in Estonia in the 2nd quarter
 Print version
 |
|---|
In the 2nd quarter, the GDP at current prices was 5.3 bln euros.
The seasonally and working-day adjusted GDP increased by 0.5% compared to the
1st quarter of 2016 and by 0.6% compared to the 2nd quarter of 2015.
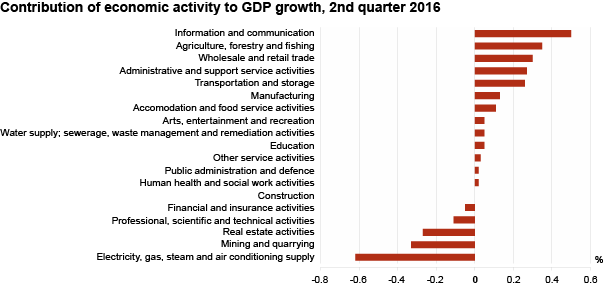
According to the second estimates, GDP growth was inhibited
the most by a decrease in value added in the energy sector, mining and
quarrying and real estate activities. In the energy sector, production of all
types of energy fell. The decrease in the value added of mining and quarrying
was caused by a fall in the extraction of oil-shale. Although the value added
of real estate activities increased at current prices, the increase in prices
in this economic activity resulted in a decrease in the value added at constant
prices.
In the 2nd quarter of 2016, GDP growth was influenced the
most by information and communication, the value added of which rose mainly due
to the rapid growth in the value added of computer programming and information
service activities. I addition, the biggest contributor to GDP growth were
agriculture, forestry and fishing, and trade. Among trade activities, retail
trade contributed the most to GDP growth and the value added of wholesale
increased as well.
Also, the value added of manufacturing (the biggest economic
activity in Estonian economy) contributed to the increase of GDP. In the 2nd
quarter, value added increased in more than half of manufacturing activities.
The main contributors to the growth of manufacturing were the manufacture of
electrical equipment, textiles and wearing apparel. At the same time, the
manufacture of fabricated metal products, electronic products and mineral
products decreased.
The export of goods and services rose by 4.1% at real
prices, mainly due to an increase in the import of electronic products,
electrical equipment and wood and articles of wood. Total import increased by
8.8% at real prices compared to the 2nd quarter of the previous year. This is
the biggest growth of the last 14 quarters. Import of goods and services was
increased the most by a growth in the import of electronic products, motor
vehicles and base metals.
In the 2nd quarter of 2016, net export amounted 3.8% of the
GDP.
Real GDP grew slower than the number of persons employed and
hours worked (respectively 2.0% and 2.9%), meaning that there was a fall in the
productivity of the total economy per person employed as well as per hour.
Compensation per employee grew faster than productivity and unit labour costs
increased 6.4% compared to the same quarter of the previous year.
Domestic demand rose. At real prices, all components of domestic
demand increased, except for the final consumption expenditures of government
sector. Households’ final consumption expenditure increased by 3.0%. The
expenditures on transport, food and recreation increased the most.
In the 2nd quarter of 2016, after having declined in the
last 8 quarters, gross fixed capital formation increased by 5.4% at real
prices. Households’ investments in dwellings as well as the gross fixed capital
formation of non-financial enterprises in buildings and structures and machinery
and equipment increased the most. At the same time, gross fixed capital
formation of the government sector decreased.
As part of a regular revision, Statistics Estonia revised the national accounts data for 2012–2015 based on the supply and use tables and annual reports of enterprises. In conjunction with the publication of the estimates for the 2nd quarter of 2016, the estimates for the 1st quarter of 2016 were also revised. Additionally, data for 2010 were revised.
More detailed information about the revisions made in 2016 and their effect is available here.


 «The Baltic Course» Is Sold and Stays in Business!
