
Analytics, Employment, EU – Baltic States, Financial Services, Labour-market, Latvia, Wages
International Internet Magazine. Baltic States news & analytics
Friday, 26.04.2024, 19:33
43.7% employees in Latvia receive up to EUR 450 in net monthly wage in Q1
 Print version
During the year, employment rate increased by 1.3 percentage points, while number of employed persons – by 5.1 thousand. As compared to the previous quarter, in the 1st quarter of 2016 employment rate dropped by 0.4 percentage points, while number of employed persons – by 10.8 thousand. Employment rate was influenced by the decline in number of corresponding age population in private households – of 23 thousand persons during the year (provisional data).
In the 1st quarter of 2016, the most notable drop in the number of employed persons was recorded in agriculture, forestry and fishing, wholesale and retail trade; repair of motor vehicles and motorcycles, as well as in accommodation and food service activities.
Since the end of 2012, employment rate in Latvia has exceeded the average level of the European Union (EU) (in the 4th quarter of 2015 – 58.4%). In the 1st quarter of 2016, the highest employment rate among the Baltic States was recorded in Estonia (64.1%), in Lithuania it also was higher than in Latvia – by 0.3 percentage points (comprising 61.3%).
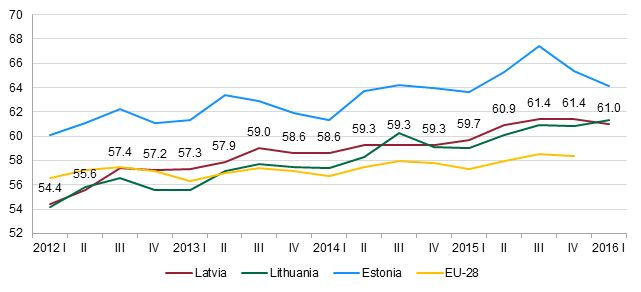 |
| Employment rate in the Baltic States and on average in the European Union, % |
Data source: Eurostat database, for data on the 1st quarter of 2016 – Labour Force Surveys of Latvia, Lithuania, and Estonia.
In the 1st quarter of 2016, employment rate among young people aged 15–24 comprised 34.2% – 0.2 percentage points more than in the corresponding period a year ago. The number of employed young people accounted for 66.5 thousand (in the 1st quarter of 2015 – for 70.4 thousand).
In the 1st quarter of 2016, persons employed in the main job worked on average 38.3 hours per week that is 0.8 hours more than in the 4th quarter of 2015.
Data of the Labour Force Survey show that, in the 1st quarter of 2016 wages and salaries received by 43.7% of the employees constituted EUR 450.00 or less (7.5 percentage points less than in the 1st quarter of 2015). 20.6% of them received minimum wage or less, and the indicator has not changed notably during the year. It should be noted that, in 2015 minimum wage comprised EUR 360, while in 2016 – EUR 370. In the 1st quarter of 2016, net wage received by 17.4% of employees accounted for EUR 700.01–1400.00 – 4 percentage points more than in the same period a year ago.
Employees by monthly net (after taxes) wages and salaries in the main job,%
|
|
1st quarter of 2015 |
4th quarter of 2015 |
1st quarter of 2016 |
|
Employees |
100.0 |
100.0 |
100.0 |
|
Up to EUR 450.00 |
51.2 |
45.7 |
43.7 |
|
of which employees receiving minimum monthly wage or less |
20.7 |
20.4 |
20.6 |
|
EUR 450.01–700.00 |
30.1 |
31.4 |
30.8 |
|
EUR 700.01–1400.00 |
13.4 |
16.1 |
17.4 |
|
EUR 1400.01 or more |
1.9 |
2.5 |
2.9 |
|
Was not calculated or paid |
1.6 |
2.7 |
2.9 |
|
Not specified |
1.8 |
1.6 |
2.3 |
Data source: Labour Force Survey conducted by the CSB.
In the 1st quarter of 2016, Labour Force Survey covered 4 thousand households, in which 7.6 thousand persons aged 15–74 were interviewed.
More information on employment statistics is available in the CSB database section Employment and Unemployment.


 «The Baltic Course» Is Sold and Stays in Business!
