
Analytics, Baltic, Economics, GDP, Latvia, Markets and Companies
International Internet Magazine. Baltic States news & analytics
Saturday, 14.03.2026, 02:08
In Q4, GDP in Latvia rose by 2.7%
 Print version
Quarterly indicators
In the 4th quarter of 2015, as compared with the 3rd quarter of 2015, GDP at constant prices, according to seasonally adjusted data, decreased by 0.3%. In the 4th quarter of 2015 as compared with the corresponding period of 2014, GDP grew by 2.3% according to seasonally adjusted data, and by 2.7% – according to seasonally non-adjusted data.
Changes of GDP volume
|
|
Mln euros, seasonally non-adjusted |
at constant prices of 2010,% |
||
|
Period |
at current prices |
at constant prices of 2010 |
over the previous period, seasonally adjusted |
over the corresponding month of the previous year, seasonally unadjusted |
|
2014 |
23 580.9 |
20 876.4 |
… |
2.4 |
|
Q 1 |
5 254.5 |
4 640.4 |
0.9 |
2.7 |
|
Q 2 |
5 831.2 |
5 205.0 |
0.4 |
2.3 |
|
Q 3 |
6 163.3 |
5 423.7 |
0.3 |
2.3 |
|
Q 4 |
6 331.9 |
5 607.3 |
0.7 |
2.1 |
|
2015*) |
24 375.6 |
21 447.6 |
… |
2.7 |
|
Q 1 |
5 389.0 |
4 725.9 |
0.5 |
1.8 |
|
Q 2 |
6 073.9 |
5 353.0 |
1.2 |
2.8 |
|
Q 3 |
6 449.8 |
5 612.2 |
0.9 |
3.5 |
|
Q 4 |
6 463.0 |
5 756.5 |
–0.3 |
2.7 |
*) Data on quarter 1 to quarter 3 of 2015 have been revised
Production approach (seasonally unadjusted data, at constant prices)
In 2015, compared with 2014, manufacturing sector grew by 4%, of which manufacture of wood and of products of wood – by 7%, manufacture of computer, electronic and optical products – by 40%, manufacture of furniture – by 14%. Drop of volume in manufacture of food products – of 5% and in manufacture of fabricated metal products – of 4% had a negative impact on manufacturing sector.
In the 4th quarter of 2015, as compared with the 4th quarter of 2014, manufacturing sector grew by 3%.
In 2015 construction production volume decreased by 1%. Drop was recorded in construction of non-residential and residential buildings of 7% and 9%, respectively, as well as in construction of industrial buildings and warehouses – of 6%. There was an increase in construction of civil engineering structures – of 5%, in construction of highways, streets, roads and railway lines – of 6%, as well as in construction of pipelines and cables – of 26%.
In the 4th quarter, as compared with the corresponding quarter of the previous year, construction production volume decreased by 6%.
Retail trade in 2015 grew by 5%, of which retail sale of automotive fuel – by 8%. There was 3% increase in trade of food products and 7% increase – in trade of non-food products.
In the 4th quarter retail trade volume increased by 3%, of which both – retail trade of food products, and retail trade of non-food products grew by 3%.
In 2015 wholesale grew by 1%, and in the 4th quarter increased by 5%.
In 2015 transport sector decreased by 0.1%. Drop was recorded in passenger traffic – of 2%, and in storage and supporting and auxiliary transport activities – of 1%. Growth of 3% was observed in freight turnover, and of 7% in postal and courier activities.
In the 4th quarter of 2015 as compared with the 4th quarter of 2014 transport sector grew by 3.5%, of which passenger traffic – by 3%, and freight turnover – by 8%.
Volume of entertainment and recreation services in 2015 increased by 5%, of which in gambling and betting sector there was a rise of 11%. In the 4th quarter of 2015 the sector rose by 4%.
GDP growth was also promoted by product taxes, which in 2015 grew by 4%, and in the 4th quarter – by 3%.
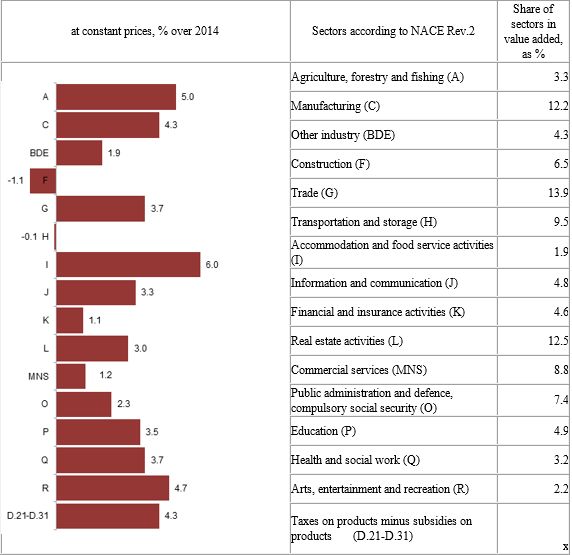 |
| Changes of GDP in 2015 by kind of economic activity |
Expenditure approach (at current prices, seasonally unadjusted data)
In 2015, compared with 2014, private final consumption grew by 4%. Households' expenditure on transport (expenditure on public transport, purchase and exploitation of transport vehicles) in private final consumption increased by 4%, expenditure on recreation and culture – by 8%, and expenditure on housing and food grew by 1%. Final consumption of households was promoted by both – the drop in prices, and the growth in households' income.
Government final consumption grew by 6%.
Gross fixed capital formation
increased by 3%. Gross fixed capital investment in equipment and machinery grew
by 12%, in intellectual property and cultivated assets – by 21%; in turn 7%
drop was recorded in investment in residential buildings and other buildings
and structures.
Export increased by 2%, of which export of goods – by 1%, and export of services – by 3%.
Import volume grew by 1%, of which import of goods decreased by 0.5%, while import of services grew by 7%.
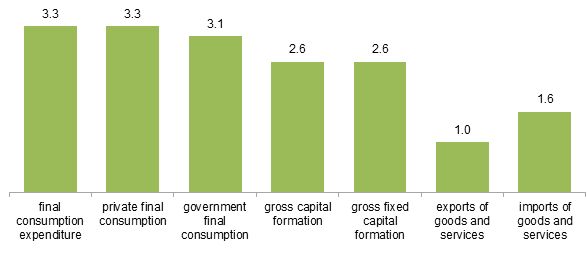 |
| Changes in expenditure approach items in 2015, at constant prices (as % over the previous year) |
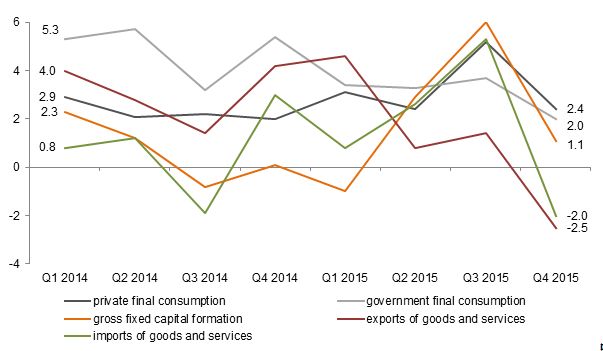 |
| Gross Domestic Product by main expenditure item at constant prices (% of the corresponding quarter of the previous year) |
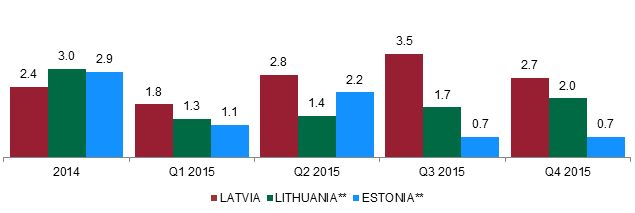 |
| Changes of Gross Domestic Product in the Baltic Countries (at constant prices, seasonally unadjusted, % of the corresponding period of the previous year) |
Possible changes in calculations of government sector, balance of payments and sectors of financial services, as well as services producer indices will be taken into account in GDP calculations and balancing of quarterly national accounts on the 85th day after the reference quarter. More information will be available in the CSB database on 24 March.
More information on GDP is available in the CSB database section Gross Domestic Product.


 «The Baltic Course» Is Sold and Stays in Business!
