
Analytics, Economics, GDP, Lithuania, Markets and Companies
International Internet Magazine. Baltic States news & analytics
Saturday, 27.04.2024, 00:40
Lithuanian GDP growth stood at 1.7% in 2015
 Print version
In IV quarter 2015, GDP amounted to EUR 9 552.2 million at current prices; compared to IV quarter 2014, the real GDP growth stood at 2.1%1 (seasonally and working day unadjusted – at 2.0%), while compared to III quarter 2015 – at 0.5%1.
Compared to the first three quarters of 2015, the GDP growth rate observed in the fourth quarter was faster, which was due to better performance results of wholesale and retail trade, repair of motor vehicles and motorcycles, transportation and storage, accommodation and food service, manufacturing, and financial and insurance enterprises.
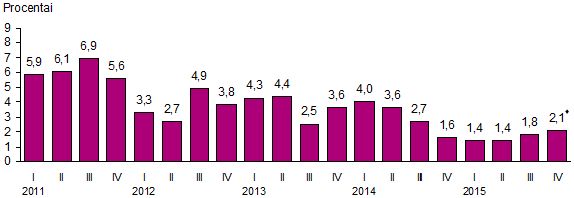 |
| Fig. 1. Changes in gross domestic product (1), compared to the same period of the previous year |
1 Seasonally and working day adjusted.
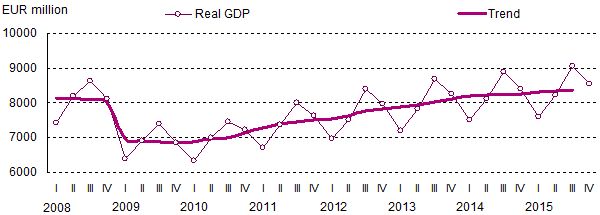 |
| Fig. 2. Changes in gross domestic product, EUR million |
Statistics Lithuania, on the basis of more comprehensive data and estimation of the value added in accordance with a more detailed list of economic activities, has revised the III quarter 2015 GDP estimate. According to the revised data, in III quarter 2015, GDP amounted to EUR 10 072.1 million at current prices. Against the same quarter of 2014, the real GDP growth stood at 1.8% (the previously published III quarter real GDP growth stood at 1.7%)1.
Gross domestic product and its changes
|
|
At current prices, EUR million |
GDP changes, % |
|||
|
against |
against |
seasonally and working |
|||
|
against |
against |
||||
|
2010 |
28 027.7 |
1.6 |
1.6 |
1.6 |
1.6 |
|
I |
6 285.9 |
–7.8 |
–1.0 |
1.5 |
–1.2 |
|
II |
7 122.5 |
10.5 |
1.3 |
1.1 |
1.3 |
|
III |
7 336.9 |
6.7 |
1.0 |
0.0 |
1.1 |
|
IV |
7 282.3 |
–3.2 |
5.2 |
2.5 |
5.2 |
|
2011 |
31 263.1 |
6.0 |
6.0 |
6.1 |
6.1 |
|
I |
6 906.7 |
–7.1 |
5.9 |
2.3 |
5.9 |
|
II |
7 974.2 |
10.0 |
5.4 |
1.3 |
6.1 |
|
III |
8 348.7 |
8.3 |
7.1 |
0.7 |
6.9 |
|
IV |
8 033.5 |
–4.5 |
5.7 |
1.2 |
5.6 |
|
2012 |
33 334.7 |
3.8 |
3.8 |
3.7 |
3.7 |
|
I |
7 480.3 |
–8.8 |
3.8 |
0.0 |
3.3 |
|
II |
8 318.0 |
8.0 |
1.9 |
0.7 |
2.7 |
|
III |
8 959.7 |
11.8 |
5.2 |
2.8 |
4.9 |
|
IV |
8 576.7 |
–5.3 |
4.3 |
0.2 |
3.8 |
|
2013◘ |
34 962.2 |
3.5 |
3.5 |
3.7 |
3.7 |
|
I |
7 695.1 |
–9.5 |
3.4 |
0.5 |
4.3 |
|
II |
8 772.3 |
8.6 |
4.1 |
0.8 |
4.4 |
|
III |
9 515.5 |
10.8 |
3.1 |
0.9 |
2.5 |
|
IV |
8 979.3 |
–4.9 |
3.6 |
1.3 |
3.6 |
|
2014* |
36 444.4 |
3.0 |
3.0 |
3.0 |
3.0 |
|
I* |
8 184.9 |
–8.9 |
4.3 |
0.9 |
4.0 |
|
II* |
9 204.6 |
8.1 |
3.8 |
0.4 |
3.6 |
|
III* |
9 777.3 |
9.5 |
2.6 |
0.1 |
2.7 |
|
IV* |
9 277.5 |
–5.7 |
1.7 |
0.2 |
1.6 |
|
2015♦ |
37 241.7 |
1.6 |
1.6 |
0.5 |
1.7 |
|
I* |
8 251.5 |
–9.3 |
1.3 |
0.7 |
1.4 |
|
II* |
9 365.9 |
8.3 |
1.4 |
0.4 |
1.4 |
|
III* |
10 072.1 |
9.8 |
1.7 |
0.5 |
1.8 |
|
IV♦ |
9 552.2 |
-5.5 |
2.0 |
0.5 |
2.1 |
♦ First estimate. * Provisional
data. ◘ Non-final data.
Real GDP changes have been estimated using a chain-linking method, which enables the elimination of the influence of price changes.
The values of and changes in GDP and its components depend on the season of the year. For this reason, for the comparison of GDP and its components' growth rates in different periods, seasonally and working day adjusted figures are used.
For more information, see Predefined tables
and the Database of
Indicators.


 «The Baltic Course» Is Sold and Stays in Business!
