
Analytics, Inflation, Lithuania, Markets and Companies
International Internet Magazine. Baltic States news & analytics
Friday, 26.04.2024, 18:37
In November, annual deflation in Lithuania stood at 0.4%
 Print version
The overall price change was mainly influenced by an increase in prices for gambling, heat energy, milk and milk products, cheese, eggs, maintenance and repair of personal transport equipment, as well as by a decrease in prices for fuels and lubricants, fruit, clothing and meat (see Table 2).
Over the said period, prices for consumer goods decreased by 0.2%, while those for consumer services increased by 1.7%. The influence of the changes in prices for consumer goods on the overall monthly price change was negative and stood at minus 0.14%age points, while the influence of the change in prices for consumer services was positive and stood at plus 0.41 percentage points.
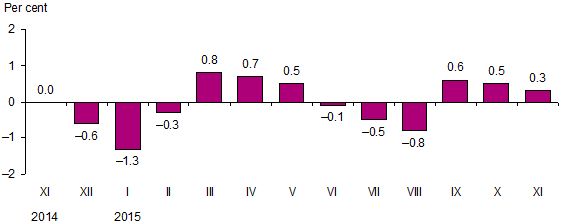 |
| Fig. 1. Monthly changes in prices for consumer goods and services, compared to the previous month |
Prices for consumer goods and services regulated by State and municipal authorities increased by 0.6%, market prices – 0.2%. The influence of the changes in prices regulated by State and municipal authorities and market prices was positive and stood at plus 0.08 and 0.19%age points respectively.
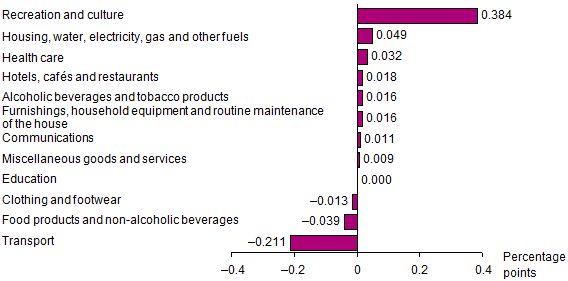 |
| Fig 2. Influence on the monthly change in prices for consumer goods and services by COICOP (1) division |
1 Classification of Individual Consumption by Purpose – COICOP.
In November 2015, against October, among food products and non-alcoholic beverages, the largest decrease in prices was observed for fruit – 2.5% (prices for citrus fruit decreased by 9.6, apples – 4.9, bananas – 2.1, pears – 2%, while prices for grapes increased by 17.7, dried fruit – 3.3%). As regards vegetables, the largest decrease in prices was observed for root vegetables – 14.1%, bulb vegetables – 5.2%, cabbages – 2.2%, while increase – green vegetables – 6.6%, potatoes – 4.5%. Natural honey went down in price by 2.7%, coffee – 2.6%, butter – 1.9%, soft drinks and beef – 1.4% each, edible animal fats – 1.2%, other edible oil – 1%, while olive oil went up in price by 2.8%, eggs – 2.4%, ice-cream and fruit and vegetable juice – 2.2% each, smoked sausages – 1.6%, other milk products – 1.3%, edible offal and confectionery – 1.2% each.
As regards goods related to energy, the largest increase in prices was observed for liquefied gas for cars – 6.7%, heat energy – 3%, liquid fuel – 4.3%, while decrease – petroleum – 5.6%, diesel fuel – 4.4%.
As for other goods, a decrease in prices was observed for lighting equipment – 5.7%, personal transport equipment parts and accessories – 1.6%, clothing materials – 1.1%, table linen and bathroom linen – 0.9%, equipment for cleaning and housing maintenance and repair products and materials – 0.8% each, while an increase – products for pets – 2.8%, small tools and equipment for house and garden – 2.4%, therapeutic appliances and flowers – 2% each, electric appliances for personal care and main tools and equipment for house and garden – 1.5% each, carpets and other floor coverings – 1.2%.
As for services, the largest increase in prices was observed for gambling services – 51.7%, telephone repair – 4.9%, funeral services – 2.3%, domestic services and household services – 2.2%, maintenance and repair of personal transport equipment – 2%, while decrease – accommodation services – 2%, passenger transport by air – 0.9%, housing rent – 0.8%, sanatoriums – 0.7%, package holidays – 0.6%.
In November 2015, annual (November 2015 against November 2014) deflation stood at 0.4% (in November 2014, against November 2013, inflation stood at 0.2%).
The annual deflation was mainly influenced by a decrease in prices for fuels and lubricants, heat energy, solid fuel, milk and milk products, cheese, eggs, as well as by an increase in prices for gambling services, vegetables, catering in restaurants, cafés and the like, clothing, pharmaceuticals, housing rent services.
Over the year, prices for consumer goods decreased by 2.1%, those for services increased by 5.2%.
In November 2015, against November 2014, prices for consumer goods and services regulated by State and municipal authorities decreased by 3.1%, while market prices increased by 0.1%.
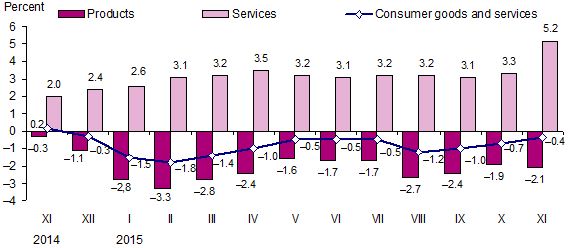 |
| Fig. 3. Annual changes in prices for consumer goods and services, compared to the respective month of the previous year |
In November 2015, average annual deflation stood at 0.9% (in November 2014, average annual inflation stood at 0.2%).
Table 1. Changes in prices for consumer goods and services, November 2015, %
|
COICOP divisions of consumer
goods |
Relative |
Price growth, drop (–) |
|||
|
November 2015, against |
average annual |
||||
|
October |
2014 |
||||
|
De- |
No- |
November 2014–2015 |
|||
|
Total CPI |
100.0 |
0.3 |
0.3 |
–0.4 |
–0.9 |
|
Food products and non-alcoholic beverages |
24.7 |
–0.2 |
0.0 |
–0.3 |
–0.8 |
|
Alcoholic beverages and tobacco products |
7.8 |
0.2 |
2.0 |
1.2 |
2.2 |
|
Clothing and footwear |
7.8 |
–0.2 |
4.3 |
3.2 |
0.4 |
|
Housing, water, electricity, gas
and other |
13.6 |
0.4 |
–5.7 |
–6.2 |
–4.5 |
|
Furnishings, household equipment
and |
5.1 |
0.3 |
2.5 |
2.0 |
1.1 |
|
Health care |
6.3 |
0.5 |
4.0 |
3.9 |
2.8 |
|
Transport |
13.3 |
–1.6 |
–5.7 |
–8.0 |
–7.1 |
|
Communications |
3.3 |
0.3 |
1.2 |
1.5 |
–0.1 |
|
Recreation and culture |
6.4 |
5.9 |
7.9 |
8.2 |
2.3 |
|
Education |
1.7 |
0.0 |
3.0 |
3.1 |
2.1 |
|
Hotels, cafés and restaurants |
4.3 |
0.4 |
5.2 |
5.2 |
4.6 |
|
Miscellaneous goods and services |
5.7 |
0.2 |
2.2 |
2.1 |
2.3 |
Table 2. Largest influence on the overall change in consumer prices over the month by COICOP class of consumer goods and services
|
COICOP classes of consumer goods and services |
Relative share (weight) |
Price growth, drop (–),% |
Influence,%age |
|
November 2015, against October |
|||
|
Gambling |
0.7 |
51.7 |
+0.359 |
|
Heat energy |
2.8 |
3.0 |
+0.070 |
|
Milk and milk products, cheese and eggs |
4.0 |
1.0 |
+0.038 |
|
Maintenance and repair of personal transport equipment |
1.7 |
2.0 |
+0.035 |
|
Catering services of restaurants, cafés and the like |
2.7 |
0.7 |
+0.021 |
|
Pharmaceuticals |
3.6 |
0.5 |
+0.019 |
|
Vegetables |
1.6 |
–0.8 |
–0.015 |
|
Coffee, tea and cocoa |
1.1 |
–2.0 |
–0.022 |
|
Meat |
6.4 |
–0.4 |
–0.022 |
|
Clothing |
5.0 |
–0.5 |
–0.027 |
|
Fruit |
1.6 |
–2.5 |
–0.044 |
|
Fuels and lubricants |
6.2 |
–4.0 |
–0.231 |
|
November 2015, against November 2014 |
|||
|
Gambling |
0.7 |
57.1 |
+0.381 |
|
Vegetables |
1.6 |
17.1 |
+0.271 |
|
Catering services of restaurants, cafés and the like |
2.7 |
6.0 |
+0.159 |
|
Clothing |
5.0 |
2.6 |
+0.129 |
|
Pharmaceuticals |
3.6 |
3.5 |
+0.127 |
|
Housing rent services |
0.6 |
18.7 |
+0.110 |
|
Electricity |
2.5 |
–6.3 |
–0.156 |
|
Meat |
6.4 |
–2.6 |
–0.163 |
|
Milk and milk products, cheese and eggs |
4.0 |
–4.4 |
–0.176 |
|
Solid fuel |
2.0 |
–12.4 |
–0.247 |
|
Heat energy |
2.8 |
–15.7 |
–0.437 |
|
Fuels and lubricants |
6.2 |
–16.6 |
–1.106 |
The overall change in consumer prices is influenced not only by the size of the price change for a certain product but also by the relative share (weight) of expenditure on that product in the total consumption expenditure.
In 2015, 907 consumer goods and services, whose retail prices are registered on a monthly basis in 3970 selected enterprises and local units of all forms (public, private) and types (supermarkets, shopping and leisure centres, specialised and non-specialised stores, online shops, kiosks, markets, gas stations, enterprises providing catering and other services) of ownership and sizes (large, middle-sized, small), were selected for the compilation of the consumer price index.
Concepts
Deflation refers to a long-lasting decrease in the general price level, which results in an increase in the purchasing power of money.
Inflation is a long-term increase in the general price level, resulting in a decrease in the purchasing power of money. Inflation is usually calculated based on the consumer price index and expressed in per cent.
Annual inflation shows the relative change in the average price level between the reporting month and the corresponding month of the previous year.
Average annual inflation shows the relative change in the average price level between the last twelve months and the corresponding previous twelve months.
More information on the issue is available in the Database of
Indicators of Statistics Lithuania.


 «The Baltic Course» Is Sold and Stays in Business!
