
Analytics, Economics, GDP, Lithuania, Markets and Companies
International Internet Magazine. Baltic States news & analytics
Friday, 26.04.2024, 21:25
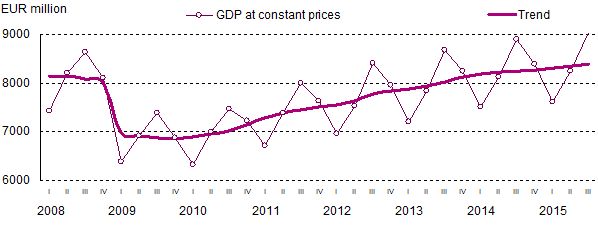
GDP in Lithuania rose by 1.7% in Q3 y-o-y
 Print version
Compared to II quarter 2015, the real GDP change was positive and stood at 0.4%1.
In III quarter 2015, against III quarter 2014, positive changes in the value added1 were observed in all economic activities. The fastest growth in the value added was observed in enterprises engaged in construction (4.1%), manufacturing (2.9%), wholesale and retail trade, repair of motor vehicles and motorcycles, transportation and storage, accommodation and food service activities (2%).
In III quarter 2015, against III quarter 2014, final household consumption expenditure grew by 6.4%, gross fixed capital formation – 12.4%. Exports of goods and services, which were on the increase during the first two quarters of 2015, decreased by 0.7% in III quarter 2015. Imports of goods and services grew by 5.3%.
 |
| GDP changes |
In the first three quarters of 2015, GDP at current prices amounted to EUR 27 630 million. Compared to the first three quarters of 2014, the real GDP change stood at 1.5%1 (seasonally and working day unadjusted – 1.5%).
Table 1. Gross domestic product and its changes
|
|
At current prices, EUR million |
GDP changes, % |
|||
|
against |
against |
seasonally and working |
|||
|
against |
against |
||||
|
2010 |
28 027.7 |
1.6 |
1.6 |
1.6 |
1.6 |
|
I |
6 285.9 |
–7.8 |
–1.0 |
1.5 |
–1.2 |
|
II |
7 122.5 |
10.5 |
1.3 |
1.1 |
1.3 |
|
III |
7 336.9 |
6.7 |
1.0 |
0.0 |
1.1 |
|
IV |
7 282.3 |
–3.2 |
5.2 |
2.5 |
5.2 |
|
2011 |
31 263.1 |
6.0 |
6.0 |
6.1 |
6.1 |
|
I |
6 906.7 |
–7.1 |
5.9 |
2.3 |
5.9 |
|
II |
7 974.2 |
10.0 |
5.4 |
1.3 |
6.1 |
|
III |
8 348.7 |
8.3 |
7.1 |
0.7 |
6.9 |
|
IV |
8 033.5 |
–4.5 |
5.7 |
1.2 |
5.6 |
|
2012 |
33 334.7 |
3.8 |
3.8 |
3.7 |
3.7 |
|
I |
7 480.3 |
–8.8 |
3.8 |
0.0 |
3.3 |
|
II |
8 318.0 |
8.0 |
1.9 |
0.7 |
2.7 |
|
III |
8 959.7 |
11.8 |
5.2 |
2.8 |
4.9 |
|
IV |
8 576.7 |
–5.3 |
4.3 |
0.2 |
3.8 |
|
2013◘ |
34 962.2 |
3.5 |
3.5 |
3.7 |
3.7 |
|
I |
7 695.1 |
–9.5 |
3.4 |
0.5 |
4.3 |
|
II |
8 772.3 |
8.6 |
4.1 |
0.8 |
4.4 |
|
III |
9 515.5 |
10.8 |
3.1 |
0.9 |
2.5 |
|
IV |
8 979.3 |
–4.9 |
3.6 |
1.3 |
3.6 |
|
2014* |
36 444.4 |
3.0 |
3.0 |
3.0 |
3.0 |
|
I* |
8 184.9 |
–8.9 |
4.3 |
0.9 |
4.0 |
|
II* |
9 204.6 |
8.1 |
3.8 |
0.4 |
3.6 |
|
III* |
9 777.3 |
9.5 |
2.6 |
0.1 |
2.7 |
|
IV* |
9 277.5 |
–5.7 |
1.7 |
0.2 |
1.6 |
|
2015♦ |
|
|
|
|
|
|
I* |
8 251.5 |
–9.3 |
1.3 |
0.7 |
1.4 |
|
II* |
9 365.9 |
8.3 |
1.4 |
0.4 |
1.4 |
|
III♦ |
10 012.9 |
9.7 |
1.7 |
0.4 |
1.7 |
Table 2. Changes in gross value added (1) by group of economic activity (2), compared to the same period of the previous year, %
|
|
A |
B + C + D + E |
C |
F |
G + H + I |
J |
K |
L |
M + N |
O + P + Q |
R + S + T |
|
2010 |
–7.0 |
6.7 |
8.9 |
–6.4 |
4.4 |
2.3 |
10.2 |
–1.2 |
–2.5 |
–2.4 |
–6.2 |
|
I |
3.2 |
0.5 |
–2.4 |
–22.4 |
0.7 |
0.7 |
1.5 |
–0.8 |
0.5 |
–2.9 |
–11.4 |
|
II |
–5.9 |
4.8 |
7.5 |
–8.3 |
4.5 |
2.1 |
8.2 |
–1.5 |
3.6 |
–3.5 |
–6.8 |
|
III |
–20.0 |
6.5 |
10.6 |
3.5 |
7.8 |
5.2 |
15.8 |
–1.9 |
–8.1 |
–1.4 |
0.1 |
|
IV |
–3.3 |
15.2 |
20.6 |
5.4 |
4.6 |
1.3 |
16.2 |
–0.8 |
–5.7 |
–1.8 |
–6.0 |
|
2011 |
7.4 |
7.3 |
10.1 |
19.5 |
8.0 |
–4.6 |
9.5 |
1.3 |
3.7 |
0.2 |
4.3 |
|
I |
1.5 |
12.4 |
17.8 |
17.9 |
9.4 |
–7.2 |
8.8 |
1.0 |
0.4 |
–1.7 |
3.4 |
|
II |
4.0 |
11.2 |
13.1 |
15.3 |
6.9 |
–5.3 |
10.5 |
0.6 |
1.2 |
0.6 |
1.4 |
|
III |
14.6 |
7.8 |
9.3 |
18.0 |
6.6 |
–5.3 |
13.0 |
–1.4 |
6.6 |
0.0 |
3.2 |
|
IV |
10.1 |
–1.2 |
1.6 |
26.8 |
9.0 |
–0.4 |
5.7 |
5.1 |
6.8 |
1.7 |
9.5 |
|
2012◘ |
11.8 |
3.2 |
4.5 |
–5.5 |
7.0 |
3.9 |
–6.0 |
1.7 |
5.2 |
1.5 |
6.0 |
|
I |
7.8 |
0.8 |
1.1 |
6.1 |
6.1 |
6.1 |
–0.4 |
1.3 |
5.7 |
2.1 |
4.2 |
|
II |
12.7 |
–1.1 |
0.4 |
–1.5 |
5.8 |
5.0 |
–5.6 |
0.6 |
4.4 |
1.1 |
8.3 |
|
III |
17.5 |
4.8 |
7.0 |
–11.0 |
7.5 |
1.8 |
–9.3 |
4.3 |
4.7 |
1.6 |
6.4 |
|
IV |
9.3 |
8.2 |
9.4 |
–13.7 |
8.7 |
3.0 |
–8.6 |
0.6 |
5.9 |
1.1 |
5.2 |
|
2013* |
–3.6 |
3.8 |
5.1 |
9.5 |
3.9 |
5.9 |
2.8 |
2.8 |
6.3 |
0.9 |
7.7 |
|
I |
3.0 |
6.9 |
8.8 |
–4.7 |
4.9 |
5.7 |
–3.0 |
1.6 |
4.7 |
0.7 |
7.3 |
|
II |
–3.0 |
5.7 |
7.3 |
8.3 |
4.0 |
5.9 |
2.5 |
3.2 |
7.3 |
1.1 |
7.5 |
|
III |
–9.2 |
0.9 |
1.2 |
16.0 |
3.8 |
5.6 |
5.2 |
3.7 |
6.5 |
1.0 |
6.8 |
|
IV |
–4.5 |
1.9 |
3.5 |
19.2 |
2.8 |
6.5 |
6.9 |
2.8 |
6.8 |
0.8 |
9.3 |
|
2014* |
3.4 |
3.3 |
4.1 |
14.1 |
1.9 |
2.6 |
–0.8 |
2.6 |
2.6 |
0.8 |
4.8 |
|
I* |
2.2 |
3.3 |
5.0 |
24.7 |
3.9 |
4.0 |
3.3 |
3.3 |
3.6 |
0.9 |
5.3 |
|
II* |
4.2 |
4.1 |
5.1 |
12.3 |
3.6 |
1.5 |
–0.6 |
3.3 |
1.7 |
0.8 |
3.6 |
|
III* |
5.6 |
2.4 |
3.2 |
10.6 |
1.5 |
3.1 |
–3.6 |
2.2 |
3.7 |
0.6 |
6.3 |
|
IV* |
1.7 |
3.5 |
3.0 |
10.0 |
–1.5 |
2.1 |
–2.1 |
1.7 |
1.6 |
0.8 |
3.9 |
|
2015 |
|
|
|
|
|
|
|
|
|
|
|
|
I* |
–8.3 |
1.4 |
2.1 |
7.3 |
0.4 |
–0.8 |
–1.8 |
–2.3 |
2.3 |
0.8 |
2.3 |
|
II* |
–9.6 |
1.9 |
2.2 |
8.1 |
1.3 |
1.2 |
–0.3 |
–2.0 |
2.0 |
0.3 |
0.8 |
|
III♦ |
0.1 |
2.1 |
2.9 |
4.1 |
2.0 |
2.6 |
2.1 |
1.1 |
1.9 |
0.7 |
1.5 |
Table 3. Changes in the main GDP components estimated by expenditure approach (1), compared to the same period of the previous year, %
|
|
Final consumption expenditure |
Gross fixed capital formation |
Exports of goods and services |
Imports of goods and services |
||
|
total |
household |
general government |
||||
|
2010 |
-3.4 |
-3.7 |
-3.6 |
1.3 |
18.7 |
18.4 |
|
I |
-7.4 |
-7.1 |
-4.0 |
-23.0 |
4.9 |
5.5 |
|
II |
-6.7 |
-5.5 |
-5.0 |
-3.2 |
20.8 |
17.5 |
|
III |
-1.1 |
-2.9 |
-2.6 |
20.5 |
24.3 |
20.8 |
|
IV |
1.9 |
1.1 |
-2.7 |
17.3 |
25.4 |
30.2 |
|
2011 |
3.6 |
4.5 |
0.2 |
20.3 |
15.1 |
14.3 |
|
I |
2.1 |
3.0 |
-1.2 |
32.9 |
23.3 |
26.5 |
|
II |
4.2 |
5.2 |
0.5 |
26.3 |
18.2 |
18.6 |
|
III |
3.2 |
5.6 |
0.2 |
12.4 |
12.8 |
10.8 |
|
IV |
4.8 |
4.3 |
1.5 |
12.8 |
7.5 |
3.7 |
|
2012◘ |
2.9 |
3.4 |
1.2 |
-1.9 |
12.2 |
5.5 |
|
I |
4.5 |
4.4 |
1.1 |
3.1 |
8.4 |
0.7 |
|
II |
2.7 |
2.9 |
0.9 |
-1.2 |
7.9 |
-1.5 |
|
III |
2.3 |
2.8 |
1.6 |
-4.0 |
14.0 |
10.4 |
|
IV |
2.0 |
3.5 |
1.2 |
-5.1 |
18.3 |
12.4 |
|
2013* |
3.8 |
4.9 |
1.1 |
8.4 |
9.7 |
10.4 |
|
I |
2.9 |
4.0 |
1.5 |
0.9 |
17.0 |
15.2 |
|
II |
3.4 |
4.9 |
1.4 |
7.2 |
12.5 |
14.1 |
|
III |
4.9 |
5.6 |
0.8 |
12.4 |
6.6 |
7.1 |
|
IV |
3.8 |
5.1 |
0.8 |
13.5 |
3.6 |
6.2 |
|
2014* |
3.5 |
3.6 |
1.2 |
5.3 |
2.9 |
2.8 |
|
I* |
3.3 |
4.3 |
0.8 |
11.8 |
-0.1 |
-2.3 |
|
II* |
4.1 |
4.0 |
1.1 |
5.3 |
4.1 |
7.1 |
|
III* |
2.6 |
3.0 |
1.3 |
3.3 |
4.4 |
3.0 |
|
IV* |
3.9 |
3.2 |
1.7 |
1.5 |
3.3 |
3.4 |
|
2015 |
|
|
|
|
|
|
|
I* |
4.1 |
4.7 |
2.2 |
6.0 |
3.6 |
10.2 |
|
II* |
4.4 |
5.1 |
2.5 |
12.4 |
0.8 |
9.0 |
|
III♦ |
4.7 |
6.4 |
2.1 |
12.4 |
-0.7 |
5.3 |
♦ Second estimate. * Provision data.
◘ Non-final data.
_______________________
1 Seasonally and working day, and price change adjusted.
2 A – agriculture, forestry and fishing; B + C + D + E – mining and
quarrying; manufacturing; electricity, gas, steam and air conditioning supply;
water supply; sewerage, waste treatment and remediation activities; C –
manufacturing; F – construction; G + H + I – wholesale and retail trade; repair
of motor vehicles and motorcycles; transportation and storage; accommodation
and food service activities; J – information and communication; K – financial
and insurance activities; L – real estate activities; M + N – professional,
scientific and technical activities; administrative and support service
activities; O + P + Q – public administration and defence; compulsory social
security; education; human health and social work; R + S + T – arts,
entertainment and recreation; repair of household goods and other services.
Real GDP changes have been estimated using a chain-linking method, which enables the elimination of the influence of price changes.
Values of and changes in GDP and its components depend on the different seasons of the year; therefore, changes used for the comparison of GDP and its components for different periods are seasonally and working day adjusted.
For more information, see the Predefined Tables
and Database of
Indicators.


 «The Baltic Course» Is Sold and Stays in Business!
