
Analytics, Employment, Labour-market, Lithuania, Markets and Companies
International Internet Magazine. Baltic States news & analytics
Wednesday, 08.05.2024, 02:07
In Q3, the unemployment rate in Lithuania decreased to 8.3%
 Print version
In III quarter 2015, the male unemployment rate stood at 9.1%, female – 7.6%.
In III quarter 2015, the long-term unemployment rate stood at 3.7%; over a quarter, it decreased by 0.6 percentage points, over a year – by 0.6 percentage points as well.
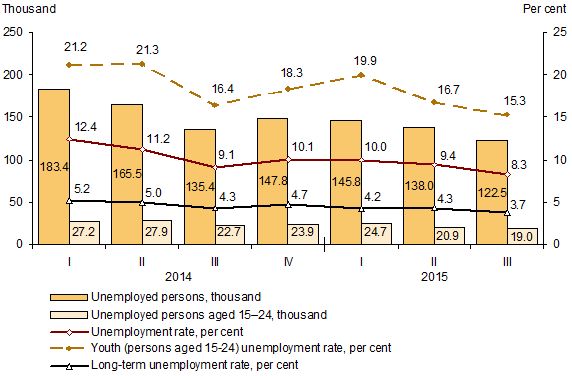 |
| Unemployment in 2014–2015, by quarters |
In III quarter 2015, there were 122.5 thousand unemployed persons aged 15–74. Over a quarter, the number of unemployed persons decreased by 15.5 thousand (11.3%), over a year – by 12.9 thousand (9.5%).
The number of the long-term unemployed was 53.7 thousand (43.9% of the total number of the unemployed), which is by 9.1 thousand (14.4%) less than in II quarter 2015, and by 10.5 thousand (16.4%) less than in III quarter 2014.
Over a quarter, the number of employed persons increased by 0.8%
In III quarter 2015, there were 1 million 347 thousand employed persons in the country. Against II quarter 2015, the number of employed persons increased by 11.2 thousand (0.8%), against III quarter 2014 – decreased by 1.8 thousand (0.1%).
In III quarter 2015, the employment rate of persons aged 15–64 stood at 68%; over a quarter, it increased by 1 percentage point, over a year – by 0.8 percentage points. The male employment rate of the said age group stood at 68.9%, female – 67.2%.
In III quarter 2015, the employment rate of persons aged 55–64 stood at 61.2%. Over a quarter, it increased by 0.9 percentage points, over a year – by 3.3 percentage points.
In III quarter 2015, there were 1 million 10 thousand economically inactive persons aged 15 and older, i.e. by 3.8 thousand (0.4%) less than in II quarter 2015.
Table 1. Unemployment rate, %
|
|
2015 |
III quarter 2014 |
Drop (-), percentage points, |
|||
|
I quarter |
II quarter |
III quarter |
II quarter 2015 |
III quarter 2014 |
||
|
Total |
10.0 |
9.4 |
8.3 |
9.1 |
–1.1 |
–0.8 |
|
male |
11.1 |
10.7 |
9.1 |
10.4 |
–1.6 |
–1.3 |
|
female |
8.9 |
8.0 |
7.6 |
7.8 |
–0.4 |
–0.2 |
|
Youth (aged 15–24) |
19.9 |
16.7 |
15.3 |
16.4 |
–1.4 |
–1.1 |
|
Long-term unemployment rate |
4.2 |
4.3 |
3.7 |
4.3 |
–0.6 |
–0.6 |
Over a quarter, the youth unemployment rate decreased by 1.4 percentage points
In III quarter 2015, the youth (persons aged 15–24) unemployment rate stood at 15.3%. Over a quarter, it decreased by 1.4 percentage points, over a year – by 1.1 percentage points.
In III quarter 2015, there were 19 thousand unemployed persons aged 15–24, which is by 1.9 thousand (9%) less than in II quarter 2015, and by 3.7 thousand (16.4%) less than in III quarter 2014. In III quarter 2015, every nineteenth person aged 15–24 was unemployed.
In III quarter 2015, there were 104.9 thousand employed persons aged 15–24. Over a quarter, the number of employed persons aged 15–24 increased by 0.9 thousand (0.8%), over a year – decreased by 10.5 thousand (9.1%).
In III quarter 2015, the youth employment rate stood at 28.6%; over a quarter, it increased by 0.7 percentage points, over a year – decreased by 1.4 percentage points. In III quarter 2015, every fourth person aged 15–24 was employed.
In III quarter 2015, 243.5 thousand (66.3%) persons aged 15–24 were economically inactive; out of them, 90.5% were studying at general, vocational schools, schools of higher education (colleges, universities).
Table 2. The unemployed, Thousand
|
|
2015 |
III quarter |
Drop (-), III quarter 2015, against |
|||||
|
I quarter |
II quarter |
III quarter |
II quarter 2015 |
III quarter 2014 |
||||
|
thousand |
per cent |
thousand |
per cent |
|||||
|
Total |
145.8 |
138.0 |
122.5 |
135.4 |
–15.5 |
–11.3 |
–12.9 |
–9.5 |
|
male |
80.7 |
78.7 |
66.1 |
77.3 |
–12.6 |
–16.0 |
–11.2 |
–14.5 |
|
female |
65.2 |
59.4 |
56.4 |
58.1 |
–3.0 |
–5.0 |
–1.7 |
–2.9 |
|
Youth (aged 15–24) |
24.7 |
20.9 |
19.0 |
22.7 |
–1.9 |
–9.0 |
–3.7 |
–16.4 |
Table 3. The unemployed by duration of unemployment, Thousand
|
|
2015 |
III quarter 2014 |
Growth, drop (-) III quarter 2015, against |
|||||
|
I quarter |
II quarter |
III quarter |
II quarter 2015 |
III quarter 2014 |
||||
|
thousand |
per cent |
thousand |
per cent |
|||||
|
Total |
145.8 |
138.0 |
122.5 |
135.4 |
–15.5 |
–11.3 |
–12.9 |
–9.5 |
|
under 1 month |
12.8 |
11.6 |
9.5 |
17.5 |
–2.1 |
–18.3 |
–8.0 |
–45.8 |
|
1–5 months |
43.9 |
34.7 |
37.8 |
28.4 |
3.1 |
9.1 |
9.4 |
33.2 |
|
6–11 months |
27.6 |
28.9 |
21.4 |
25.2 |
–7.5 |
–25.9 |
–3.8 |
–15.0 |
|
12 months and more (the long-term unemployed) |
61.6 |
62.8 |
53.7 |
64.3 |
–9.1 |
–14.4 |
–10.5 |
–16.4 |
Table 4. Economic activity of the population (persons aged 15 and older), Thousand
|
|
2015 |
III quarter 2014 |
Growth, drop (-) III quarter 2015, against |
|||||
|
I quarter |
II quarter |
III quarter |
II quarter 2015 |
III quarter 2014 |
||||
|
thousand |
per cent |
thousand |
per cent |
|||||
|
Labour force |
1 463.3 |
1 474.3 |
1 469.9 |
1 484.6 |
–4.4 |
–0.3 |
–14.7 |
–1.0 |
|
Employed persons |
1 317.5 |
1 336.3 |
1 347.4 |
1 349.2 |
11.2 |
0.8 |
–1.8 |
–0.1 |
|
males |
647.8 |
653.2 |
659.9 |
664.7 |
6.6 |
1.0 |
–4.8 |
–0.7 |
|
females |
669.7 |
683.0 |
687.6 |
684.5 |
4.5 |
0.7 |
3.1 |
0.4 |
|
Unemployed |
145.8 |
138.0 |
122.5 |
135.4 |
–15.5 |
–11.3 |
–12.9 |
–9.5 |
|
Economically inactive persons |
1 032.2 |
1 013.3 |
1 009.6 |
1 019.9 |
–3.8 |
–0.4 |
–10.3 |
–1.0 |
Table 5. Employment rate, %
|
|
2015 |
III quarter 2014 |
Growth, drop (-), percentage points, III quarter 2015, against |
|||
|
I quarter |
II quarter |
III quarter |
II quarter |
III quarter |
||
|
Employment rate of the population aged 15–64 |
66.0 |
67.0 |
68.0 |
67.2 |
1.0 |
0.8 |
|
males |
66.9 |
67.4 |
68.9 |
68.5 |
1.5 |
0.4 |
|
females |
65.1 |
66.5 |
67.2 |
66.1 |
0.7 |
1.1 |
|
Employment rate of the population aged 15–24 |
26.4 |
27.9 |
28.6 |
30.0 |
0.7 |
–1.4 |
|
Employment rate of the population aged 20–64 |
72.2 |
73.2 |
74.0 |
73.4 |
0.8 |
0.6 |
|
Employment rate of the population aged 55–64 |
58.7 |
60.3 |
61.2 |
57.9 |
0.9 |
3.3 |
Concepts
Unemployed – a non-working person of an established age (15–74 years) who has been actively seeking for a job (during the last four weeks) and is ready to start working in a certain period (two weeks).
Labour force – the total employed persons and the unemployed.
Long-term unemployed person – an unemployed person who has been seeking for a job for one year or longer.
Long-term unemployment rate – an indicator expressed as a ratio of the long-term unemployed to the labour force.
Inactive population – persons who are neither working nor seeking for a job and who can be categorised as neither employed nor unemployed.
Unemployment rate – an indicator expressed as a ratio of the unemployed to the labour force.
Employed persons – persons aged 15 and older doing any kind of work for which they are remunerated in cash or in kind or have income or profit.
Employment rate – an indicator expressed as a ratio of the employed persons of a selected age group to the total population of the same age.
The statistical information has been prepared based on the Labour Force Survey
data. The survey is carried out in all EU Member States, using the same
concepts and classifications, following the recommendations of the
International Labour Organization, which makes its results comparable across
the countries.
The survey has been carried using a sampling method. Over III quarter 2015, 12.3 thousand residents (0.5%) aged 15 and older were interviewed; the results were recalculated for the total population.
More detailed statistical information on employment and unemployment is provided in the annex.
More information on the issue is available in the Database of Indicators of Statistics Lithuania.


 «The Baltic Course» Is Sold and Stays in Business!
