
Analytics, Inflation, Lithuania, Markets and Companies
International Internet Magazine. Baltic States news & analytics
Wednesday, 08.05.2024, 18:27
In September, annual deflation in Lithuania stood at 1%
 Print version
The overall price change was mainly influenced by an increase in prices for clothing, vegetables, footwear, as well as by a decrease in prices for fuels and lubricants, passenger transport by air, package holidays services and fruit (see Table 2).
Over the said period, prices for consumer goods increased by 0.9%, those for consumer services –decreased by 0.2%. The influence of changes in prices for consumer goods on the overall monthly price change was positive and stood at plus 0.67 percentage points, while the influence of changes in prices for consumer services was negative and stood at minus 0.06 percentage points.
Prices for consumer goods and services regulated by State and municipal authorities decreased by 0.04%, market prices – increased by 0.7%. The influence of the change in prices regulated by State and municipal authorities was negative and stood at minus 0.01 percentage points, while the influence of the change in market prices was positive and stood at plus 0.62 percentage points.
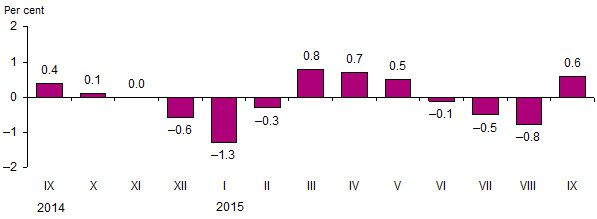 |
| Fig. 1. Monthly changes in prices for consumer goods and services, Compared to the previous month |
In September 2015, compared to August, among food products and non-alcoholic beverages, the largest increase in prices was observed for vegetables – 22.5%, while prices for fruit decreased by 2.5%. Among fruit, the largest decrease in prices was observed for grapes – by 24.9, pears – 13.5, apples – 5%; an increase in prices was observed for bananas – by 5.6%. An increase in prices was also observed for groats – by 3.5, edible offal – 3.3, oil – 2.4, baby food – 1.7, soft drinks – 1.5, pasta – 1.4, honey – 1.1, frozen fish – 0.9%; a decrease in prices was observed for fruit and vegetable juices – by 3.7, cocoa – 3.2, flour – 2.6%, fermented and processed cheese – by 2.2% each, sweets – by 2%, tea – 1.9, kefir and soured milk – 1.7%.
As regards energy goods, the largest price drop was observed for liquefied gas for cars – by 5.1, diesel fuel – 4.9, petroleum – 3.9, liquid fuel – 1.6%.
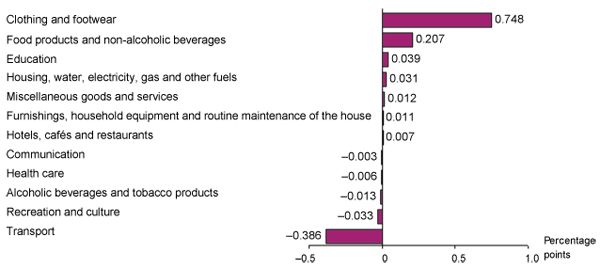 |
| Fig 2. Influence on the monthly change in prices for consumer goods and services by COICOP (1) division |
As for other goods, the largest increase in prices, due to new autumn collections, was observed for footwear – by 13.5, and clothing – 9.7%. An increase in prices was also observed for therapeutic appliances and equipment – by 2.2, flooring – 2.1, heaters, air conditioners – 2, travel accessories – 1.6, products and materials for the maintenance and repair of the dwelling – 1.4, other articles of clothing and clothing accessories – 1.1, tobacco products – 1, flowers – 0.8%. A decrease in prices was observed for equipment for camping and open-air recreation – by 3.3, wine – 2, cleaning equipment – 1.5%, small electric household appliances and data processing equipment – by 1.3% each, cosmetic products – by 0.8%, pharmaceuticals – by 0.7%.
As for services, the largest decrease in prices was observed for passenger transport by air – by 19.3, package holidays – 5, accommodation services – 3.9%, while an increase in prices was observed for recreational and sports services – by 3.1, educational services – 2.2, domestic services and household services – 1.6, furniture repair services – 1.4, catering in canteens services – by 1.2%, medical and housing rental services – by 1.1% each.
In September 2015, annual (September 2015, against September 2014) deflation stood at 1% (in September 2014, against September 2013, deflation stood at 0.1%).
Annual deflation was mainly influenced by a decrease in prices for fuels and lubricants, solid fuel, milk and milk products, cheese, eggs, meat, heat energy, as well as by an increase in prices for vegetables, clothing, housing rental, catering in restaurants, cafés and the like services, tobacco products.
Over the year, prices for consumer goods decreased by 2.4%, those for services – increased by 3.1%.
In September 2015, against September 2014, prices for consumer goods and services regulated by State and municipal authorities decreased by 1.6%, market prices – by 1%.
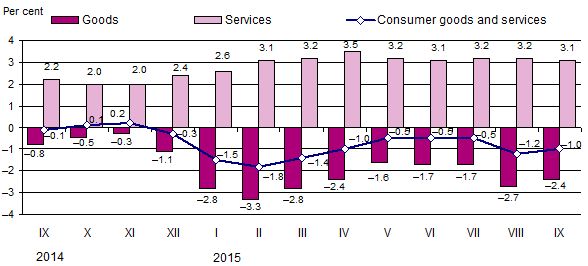 |
| Fig. 3. Annual changes in prices for consumer goods and services, compared to the respective month of the previous year |
In September 2015, average annual deflation stood at 0.8% (in September 2014, average annual inflation stood at 0.2%).
Table 1. Changes in prices for consumer goods and services, September 2015, %
|
COICOP divisions of consumer goods and services |
Relative share (weight) of consumption expenditure in total consumption expenditure |
Price growth, drop (–) |
|||
|
September 2015, against |
average annual |
||||
|
August 2015 |
2014 |
||||
|
December |
September |
September 2014–2015 |
|||
|
Consumer goods and services |
100.0 |
0.6 |
–0.5 |
–1.0 |
–0.8 |
|
Food products and non-alcoholic beverages |
24.7 |
0.8 |
–0.4 |
–1.2 |
–0.6 |
|
Alcoholic beverages and tobacco products |
7.8 |
–0.2 |
1.3 |
1.2 |
2.7 |
|
Clothing and footwear |
7.8 |
10.5 |
–0.4 |
3.2 |
–0.2 |
|
Housing, water, electricity, gas and other fuels |
13.6 |
0.2 |
–5.6 |
–4.0 |
–3.5 |
|
Furnishings, household equipment and routine maintenance of the house |
5.1 |
0.2 |
1.5 |
1.6 |
0.7 |
|
Health care |
6.3 |
–0.1 |
3.2 |
2.9 |
2.5 |
|
Transport |
13.3 |
–2.9 |
–3.6 |
–8.7 |
–6.4 |
|
Communications |
3.3 |
–0.1 |
0.7 |
0.2 |
–0.9 |
|
Recreation and culture |
6.4 |
–0.5 |
2.5 |
1.7 |
1.5 |
|
Education |
1.7 |
2.2 |
2.9 |
3.3 |
1.8 |
|
Hotels, cafes and restaurants |
4.3 |
0.2 |
4.2 |
4.2 |
4.4 |
|
Miscellaneous goods and services |
5.7 |
0.2 |
1.8 |
1.6 |
2.2 |
Table 2. Largest influence on the overall change in consumer prices over the month by COICOP class of consumer goods and services
|
COICOP classes of consumer goods and services |
Relative share (weight) of consumption expenditure in total consumption expenditure,% |
Price growth, drop (–),% |
Influence, percentagepoints |
|
September 2015, against August |
|||
|
Clothing |
5.0 |
9.7 |
+0.445 |
|
Vegetables |
1.6 |
22.5 |
+0.330 |
|
Footwear |
2.5 |
13.5 |
+0.300 |
|
Tobacco products |
2.3 |
1.0 |
+0.025 |
|
Catering services of canteens |
1.3 |
1.2 |
+0.016 |
|
Products and materials for the maintenance and repair of the dwelling |
1.1 |
1.4 |
+0.015 |
|
Fuels and lubricants |
6.2 |
–4.3 |
–0.259 |
|
Passenger transport by air services |
0.5 |
–19.3 |
–0.115 |
|
Package holidays |
0.9 |
–5.0 |
–0.050 |
|
Fruit |
1.6 |
–2.5 |
–0.046 |
|
Milk and milk products, cheese, eggs |
4.0 |
–0.8 |
–0.030 |
|
Wine |
1.3 |
–2.0 |
–0.029 |
|
September 2015, against September 2014 |
|||
|
Vegetables |
1.6 |
12.4 |
+0.196 |
|
Clothing |
5.0 |
3.3 |
+0.137 |
|
Housing rental services |
0.6 |
21.8 |
+0.130 |
|
Catering services of restaurants, cafés and the like |
2.7 |
4.5 |
+0.118 |
|
Tobacco products |
2.3 |
4.4 |
+0.103 |
|
Fruit |
1.6 |
4.7 |
+0.077 |
|
Fuels and lubricants |
6.2 |
–17.1 |
–1.201 |
|
Solid fuel |
2.0 |
–12.2 |
–0.243 |
|
Milk and milk products, cheese, eggs |
4.0 |
–5.4 |
–0.217 |
|
Meat |
6.4 |
–2.8 |
–0.182 |
|
Heat energy |
2.8 |
–6.9 |
–0.165 |
|
Elektra |
2.5 |
–6.3 |
–0.156 |
The overall change in consumer prices is influenced not only by the size of the
price change for a certain product but also by the relative share (weight) of
expenditure on that product in the total consumption expenditure.
In 2015, 907 consumer goods and services, whose retail prices are registered on a monthly basis in 3970 selected enterprises and local units of all forms of ownership (public, private), types (supermarkets, shopping and leisure centres, specialised and non-specialised stores, online shops, kiosks, markets, gas stations, enterprises providing catering and other services) and sizes (large, middle-sized, small), were selected for the compilation of the consumer price index.
Concepts
Deflation refers to a long-lasting decrease in the general price level, which results in an increase in the purchasing power of money.
Inflation is a long-lasting increase in the general price level, which results in a decrease in the purchasing power of money. Inflation is usually calculated based on the consumer price index and expressed in %.
Annual inflation shows the relative change in the average price level between the reporting month and the corresponding month of the previous year.
Average annual inflation shows the relative change in the average price level between the last twelve months and the corresponding previous twelve months.
For more information, see the Database of Indicators of Statistics Lithuania.


 «The Baltic Course» Is Sold and Stays in Business!
