
Analytics, Baltic, Economics, GDP, Latvia, Markets and Companies
International Internet Magazine. Baltic States news & analytics
Saturday, 27.04.2024, 04:43
In Q2, GDP of Latvia rose by 1.2%
 Print version
In the 2nd quarter of 2015 gross domestic product at current prices is 6.2 bln euros.
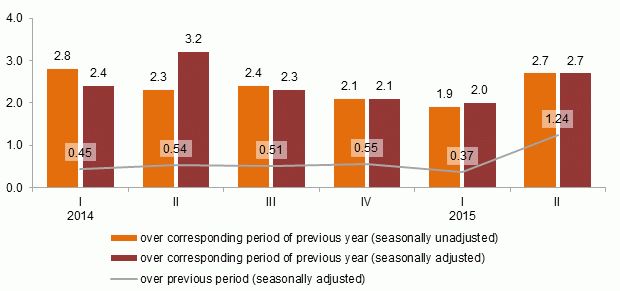 |
| Changes of GDP volume (at constant prices, as %) |
Data source: Central Statistical Bureau of Latvia
Production approach (seasonally unadjusted data, at constant prices)
In the 2nd quarter of 2015, compared with the 2nd quarter of 2014, growth rate of manufacturing comprised 6.2%, of which manufacture of wood and of products of wood – 5%, manufacture of computer, electronic and optical products – 40%, manufacture of chemicals and chemical products – 6% and manufacture of furniture – 15%. Reduction of volume in manufacture of non-metallic mineral products – by 10%, in manufacture of food products – by 7% and manufacture of fabricated metal products – by 4% had negative impact on growth rate of manufacturing.
Construction production volume reduced by 3.4%. Drop was observed in both largest segments: construction of non-residential and residential buildings by 10% and 17%, respectively. There was an increase in the construction of civil engineering structures by 7%, of which in construction of highways, streets, roads and railway lines – by 13% and in construction of local pipelines and cables – by 2%.
Retail trade grew by 5%, of which retail sale of automotive fuel – by 11%. There was a 1% increase in trade of food products and 8% increase – in trade of non-food products.Wholesale trade has decreased by 3%.
In transport sector there was a reduction in supporting and auxiliary transport activities – by 12%, but increase was in passenger transportation – by 3% and freight turnover – by 2%.
In accommodation and food service activities there was an increase of 14% and 5%.
Volume of entertainment and recreation services increased by 7%, of which in gambling and betting sector there was a rise of 17%. A drop of 7% was observed in sporting activities.
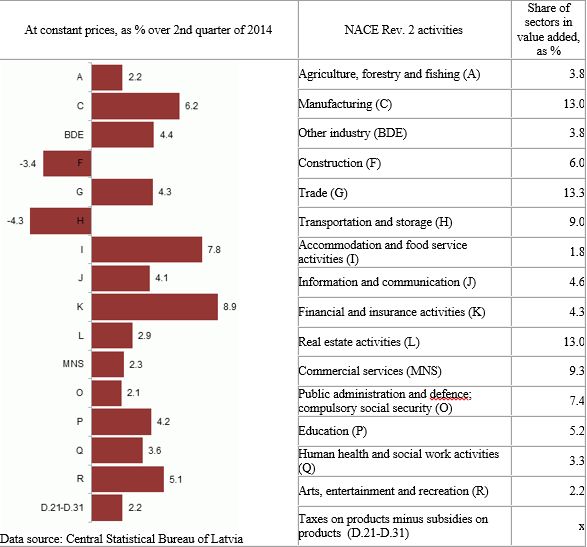 |
| Changes of GDP in the 2nd quarter of 2015 by kind of economic activity |
Expenditure approach (seasonally unadjusted data)
In the 2nd quarter of 2015, compared with the 2nd quarter of 2014, private final consumption at current prices grew by 4%. Households' expenditure on transport (expenditure on public transport, purchase and exploitation of transport vehicles) in private final consumption has risen by 6%, expenditure on recreation and culture – by 12% and expenditure on housing increased by 1%. Expenditure on food remained at the level of the previous year.
Expenditure on housing in private final consumption, at constant prices, rose on transport by 6%, on recreation and culture – by10%, on food – by 1%, but on housing – reduced by 2%.
Government final consumption at current prices has increased by 6%, but at constant prices – by 3%.
Gross fixed capital formation at current prices has increased by 5%, but at constant prices – by 3%. Non-financial investment in transportation and storage sector rose by 3% and in wholesale and retail trade and repair of motor vehicles and motorcycles – by 21%. Reduction of volume of non-financial investment was observed in public administration and defence; compulsory social security sector – by 15% and in manufacturing – by 6%.
Export of goods at current prices increased by 4%, but at constant prices – by 1%. Exports of services both at current prices and at constant prices increased by 4%.
Import of goods both at current prices and at constant prices rose by 1%. Import of services at current prices grew by 8% (at constant prices there was a drop of 2%).
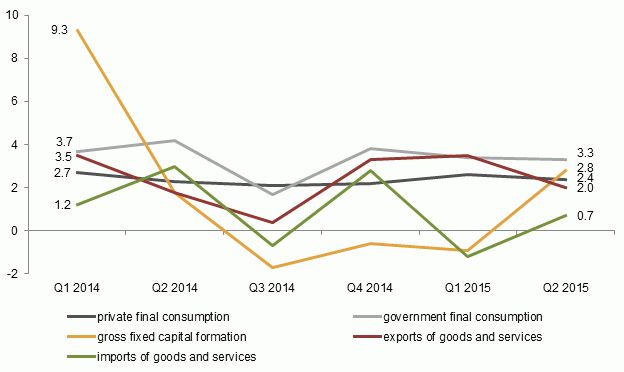 |
| Gross domestic product by main expenditure items at constant prices (% of the corresponding quarter of the previous year) |
Data source: Central Statistical Bureau of Latvia
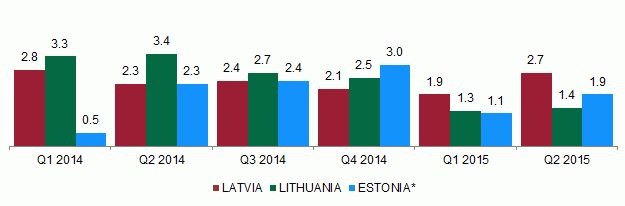
Changes of Gross Domestic Product in the Baltic Countries (at constant prices, seasonally unadjusted,
% of the corresponding period of the previous year
*Flash
estimate data for the 2nd quarter of 2015
Possible changes in calculations of government sector, balance of payments and sectors of financial services, as well as services producer indices will be taken into account in GDP calculations and balancing of quarterly national accounts on the 85th day after the reference quarter. More information will be available in the CSB database – on 23 September.
More information on GDP time series is available in the CSB database in section Gross Domestic Product.


 «The Baltic Course» Is Sold and Stays in Business!
