
Analytics, EU – Baltic States, Inflation, Lithuania, Markets and Companies
International Internet Magazine. Baltic States news & analytics
Friday, 26.04.2024, 12:29
In April, average annual harmonized deflation stood at 0.2% in Lithuania
 Print version
Average annual inflation calculated based on the CPI was also negative and stood at minus 0.4%.
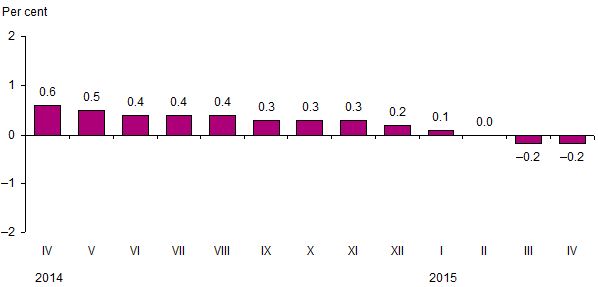 |
| Average annual inflation calculated based on the HICP |
In April 2015, annual inflation (April 2015, against April 2014) calculated based on the HICP was negative and stood at minus 0.6%; the CPI-based one was also negative and stood at minus 1%.
Overall monthly (April 2015, against March) increase in prices for consumer goods and services calculated based on the HICP stood at 0.7% and coincided with the CPI-based one.
Table 1. Rates of change in prices for consumer goods and services calculated based on the HICP, April 2015
|
COICOP/HICP1 divisions of consumer goods and services |
Relative share (weight) in total consumption expenditure, ‰ |
Price growth, drop (-), % |
||
|
April 2015, against |
Average annual |
|||
|
March 2015 |
April 2014 |
|||
|
Consumption goods and services |
1 000.0 |
0.7 |
–0.6 |
–0.2 |
|
Food products and non-alcoholic beverages |
217.5 |
2.0 |
0.0 |
0.1 |
|
Alcoholic beverages and tobacco products |
84.4 |
0.8 |
3.6 |
3.9 |
|
Clothing and footwear |
66.5 |
3.0 |
–1.1 |
–0.7 |
|
Housing, water, electricity, gas and other fuels |
120.8 |
–1.1 |
–4.0 |
–1.6 |
|
Furnishings, household equipment and routine maintenance |
62.8 |
0.2 |
0.6 |
0.3 |
|
Health care |
63.2 |
0.2 |
2.2 |
1.6 |
|
Transport |
153.1 |
0.7 |
–7.4 |
–4.4 |
|
Communications |
27.5 |
0.3 |
1.2 |
–3.7 |
|
Recreation and culture |
69.9 |
0.0 |
2.4 |
0.5 |
|
Education |
12.3 |
0.0 |
1.7 |
1.3 |
|
Hotels, cafes and restaurants |
43.4 |
0.6 |
5.0 |
3.5 |
|
Miscellaneous goods and services |
78.6 |
0.0 |
2.4 |
1.2 |
_________________
1Classification of Individual Consumption by Purpose adapted for the needs of Harmonized Index of Consumer Prices – COICOP/HICP
For the calculation of annual and average annual inflation, monthly and other period's price changes, the HICPs calculated based on the 2005 index reference period (2005 = 100) accurate to two decimal places are used. Price indices are published accurate to two decimal places, inflation and price changes – to one decimal place.
Table 2. COICOP/HICP classes of consumer goods and services whose rates of change in prices had the biggest impact on the overall price change
|
COICOP/HICP classes of consumer goods and services |
Relative share (weight) in total consumption expenditure, ‰ |
Price growth, drop (-), % |
Impact, percentage points |
|
April 2015, against March |
|||
|
Vegetables |
21.1 |
17.8 |
+0.411 |
|
Clothing |
43.4 |
3.2 |
+0.134 |
|
Footwear |
19.8 |
2.9 |
+0.054 |
|
Spirits |
21.8 |
2.0 |
+0.045 |
|
Fuels and lubricants |
73.9 |
0.5 |
+0.036 |
|
Spare parts and accessories for personal transport equipment |
19.0 |
1.8 |
+0.034 |
|
Heat energy |
22.2 |
–6.0 |
–0.132 |
|
Milk and milk products, cheese and eggs |
39.2 |
–0.7 |
–0.028 |
|
Other services n.e.c. |
19.1 |
–1.2 |
–0.023 |
|
Package holidays |
6.3 |
–3.2 |
–0.021 |
|
Sugar, jam, honey, chocolate and confectionary |
14.7 |
–0.8 |
–0.013 |
|
Materials for the maintenance and repair of the dwelling |
20.7 |
–0.6 |
–0.012 |
|
April 2015, against April 2014 |
|||
|
Vegetables |
21.1 |
4.3 |
+0.187 |
|
Services of restaurants, cafés and the like |
25.4 |
5.7 |
+0.181 |
|
Coffee, tea and cocoa |
10.6 |
15.0 |
+0.139 |
|
Wine |
17.4 |
6.4 |
+0.111 |
|
Tobacco products |
25.4 |
3.6 |
+0.106 |
|
Spirits |
21.8 |
3.2 |
+0.070 |
|
Fuels and lubricants |
73.9 |
–13.8 |
–1.023 |
|
Heat energy |
22.2 |
–11.8 |
–0.292 |
|
Solid fuel |
13.8 |
–14.0 |
–0.208 |
|
Milk and milk products, cheese and eggs |
39.2 |
–4.8 |
–0.192 |
|
Gas |
8.1 |
–16.4 |
–0.149 |
|
Electricity |
17.6 |
–6.3 |
–0.110 |
The overall change in consumer prices is influenced not only by the size of the
price change for a certain product but also by the relative share of
expenditure on that product in the total consumption expenditure.
DIFFERENCES BETWEEN THE HICP AND THE CPI
Purpose. The HICP is an instrument for measuring inflation in the EU and making international comparisons, as well as for the compilation of the European index of consumer prices (covering 28 EU member states), Monetary Union index of consumer prices (covering 19 EU member states belonging to the euro area: Austria, Belgium, Cyprus, Estonia, Finland, France, Germany, Greece, Ireland, Italy, Latvia, Lithuania, Luxembourg, Malta, the Netherlands, Portugal, Slovakia, Slovenia and Spain), and the European Economic Area index of consumer prices (covering 28 EU member states, Iceland and Norway). The extent to which a country fulfils the price stability criterion established in Article 140 of the Treaty on the Functioning of the European Union is measured taking into consideration the inflation rate calculated based on the HICP.
The CPI is used to measure the inflation rate in the country; it is the key instrument for indexation.
Coverage. The HICP, alongside consumption expenditure incurred by the residents of the country, covers consumption expenditure incurred by non-residents and visitors from abroad within the economic territory of the country. The CPI covers consumption expenditure incurred only by the residents of the country within the economic territory of the country. The HICP does not cover household expenditure on games of chance and financial intermediation services, while the CPI does cover them.
Weights. Due to a different coverage of consumption expenditure, weighting systems used for the HICP and CPI compilation differ. This is the primary factor leading to differences in index values.
Classification. For the calculation of the CPI, the Classification of Individual Consumption by Purpose (COICOP) is used. The Classification of Individual Consumption by Purpose adapted to the needs of HICPs has been adjusted for the calculation of the HICP.
Concepts
Inflation is a long-term increase in the general price level, resulting in a decrease in the purchasing power of money. Inflation is usually calculated based on the consumer price index and expressed in per cent
Annual inflation shows the relative change in the average price level in the reporting month and the corresponding month of the previous year.
Average annual inflation shows the relative change in the average price level in the last twelve months and the corresponding previous twelve months.
Harmonized index of consumer prices – a consumer price index compiled according to a methodology harmonised across the European Union.
Consumer price index – a relative indicator reflecting the overall change in prices for consumer goods and services purchased by households to satisfy their consumption needs over a certain period of time.
Statistical information about May 2015 inflation calculated based on the HICP will be published on 9 June 2015.
For more information on the issue, please see the Database of Indicators of Statistics Lithuania and Eurostat's website.


 «The Baltic Course» Is Sold and Stays in Business!
