
Analytics, Inflation, Lithuania, Markets and Companies
International Internet Magazine. Baltic States news & analytics
Saturday, 27.04.2024, 01:47
Annual deflation in March made 1.4% in Lithuania
 Print version
The inflation in March (against February) was mainly influenced by an increase in prices for fuels and lubricants, clothing, footwear, as well as by a decrease in prices for milk and milk products, cheese and eggs, meat, bread and cereals, tobacco products (see Table 2).
Over the said period, prices for consumer goods increased by 1, for consumer services – by 0.2%. The influence of the change in prices for consumer goods and services on the overall monthly price change was positive and stood at 0.72 and 0.05 percentage points respectively.
Prices for consumer goods and services regulated by State and municipal authorities increased by 0.1, market prices – by 0.9%. The influence of the change both in prices regulated by State and municipal authorities and in market prices was positive and stood at 0.01 and 0.76 percentage points respectively.
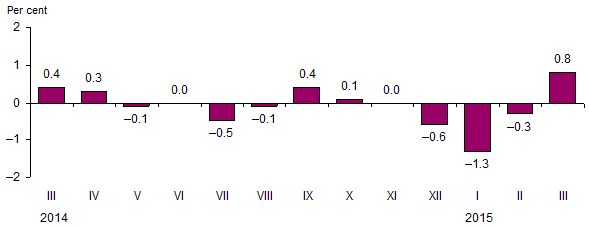 |
| Fig. 1. Monthly changes in prices for consumer goods and services, compared to the previous month |
In March 2015, against February, among food products and non-alcoholic beverages, the largest decrease in prices was observed for milk and milk products, cheese – by 1.8%, bread and cereals – 0.9%, meat and sugar, jam, honey, chocolate and confectionery – by 0.8% each, while an increase in prices was observed for fruit – by 2.7, coffee – 0.8, vegetables – 0.7%.
As regards energy goods, the largest increase in prices was observed for petrol – by 7.6, diesel fuel – 4.7, liquid fuel – 4.4, heat energy – 1%, while prices for liquefied gas for cars decreased by 4.1, liquefied gas for cooking – 1.8, solid fuel – 0.4%.
With the appearance of new spring collections, clothing went up in price by 6, footwear – by 5.6%.
From 1 March 2015, higher excise duties are applied to alcoholic beverages, which partially influenced their prices: wine went up in price by 3.5, beer – by 1.9%. Despite the fact that from the 1st of March tobacco products are also applied higher excise duties, their prices decreased by 1.2%, which was due to discounts.
As for other goods, the largest price growth was observed for equipment for sport, camping and open-air recreation – by 7.5, flowers – 2.8, bicycles – 1.5, other personal items – 1.4%, while prices for materials for the maintenance and repair of the dwelling decreased by 1.4, major electric and non-electric household appliances – by 0.8%.
As for services, the largest increase in prices was observed for the services of sanatoriums – by 3.5, package holidays – 0.9, dwelling rental, repair of household appliances, domestic services and household services – by 0.8% each, cleaning, repair and hire of clothing, accommodation services – by 0.7% each, while prices for the repair of furniture decreased by 1, photocopying services – by 0.8%.
In March 2015, annual (March 2015, against March 2014) deflation stood at 1.4% (in March 2014, against March 2013, inflation stood at 0.2%).
Annual deflation was mainly influenced by a decrease in prices for fuels and lubricants, solid fuel, heat energy, gas, milk and milk products, cheese and eggs, as well as by an increase in prices for catering in restaurants, cafes and similar establishments, coffee, tea and cocoa, fruit, tobacco products, spirits, dwelling rental services.
Over the year, prices for consumer goods decreased by 2.8%, those for services – increased by 3.2%.
In March 2015, against March 2014, prices for consumer goods and services regulated by State and municipal authorities decreased by 1.9, market prices – by 1.3%.
In March 2015, average annual deflation stood at 0.3% (in March 2014, average annual inflation stood at 0.6%).
Table 1. Changes in prices for consumer goods and services, March 2015, %
|
COICOP divisions of consumer goods and services |
Relative share (weight) of consumption expenditure in total consumption expenditure |
Price growth, drop (–) |
|||
|
March 2015, against |
average annual |
||||
|
February 2015 |
2014 |
||||
|
December |
March |
March 2014–2015 |
|||
|
Total CPI |
100.0 |
0.8 |
–0.9 |
–1.4 |
–0.3 |
|
Food products and non-alcoholic beverages |
24.7 |
–0.4 |
–0.3 |
–1.7 |
0.2 |
|
Alcoholic beverages and tobacco products |
7.8 |
0.9 |
0.9 |
3.4 |
3.8 |
|
Clothing and footwear |
7.8 |
5.9 |
–5.5 |
–1.5 |
–0.6 |
|
Housing, water, electricity, gas and other fuels |
13.6 |
0.0 |
–3.0 |
–4.5 |
–1.8 |
|
Furnishings, household equipment and routine maintenance of the house |
5.1 |
0.6 |
0.8 |
0.6 |
–0.1 |
|
Health care |
6.3 |
0.1 |
1.0 |
2.3 |
1.7 |
|
Transport |
13.3 |
2.5 |
–2.5 |
–7.9 |
–4.1 |
|
Communications |
3.3 |
0.2 |
–0.2 |
0.6 |
–4.6 |
|
Recreation and culture |
6.4 |
0.4 |
1.7 |
1.8 |
0.5 |
|
Education |
1.7 |
0.1 |
0.3 |
1.8 |
1.3 |
|
Hotels, cafes and restaurants |
4.3 |
0.3 |
1.3 |
4.4 |
3.4 |
|
Miscellaneous goods and services |
5.7 |
–0.3 |
0.7 |
2.3 |
1.3 |
Table 2. Largest influence on the overall change in consumer prices over the month by COICOP class of consumer goods and services
|
COICOP
classes of consumer |
Relative share (weight) of consumption expenditure in total consumption expenditure, % |
Price growth, drop (–), % |
Influence, percentage points |
|
March 2015, against February |
|||
|
|
|
|
|
|
Fuels and lubricants |
6.2 |
5.5 |
+0.316 |
|
Clothing |
5.0 |
6.0 |
+0.271 |
|
Footwear |
2.5 |
5.6 |
+0.129 |
|
Wine |
1.3 |
3.5 |
+0.047 |
|
Fruit |
1.6 |
2.7 |
+0.045 |
|
Beer |
1.5 |
1.9 |
+0.029 |
|
Milk and milk products, cheese and eggs |
4.0 |
–1.5 |
–0.059 |
|
Meat |
6.4 |
–0.8 |
–0.054 |
|
Bread and cereals |
4.2 |
–0.9 |
–0.040 |
|
Tobacco products |
2.3 |
–1.2 |
–0.029 |
|
Materials for the maintenance and repair of the dwelling |
1.1 |
–1.4 |
–0.016 |
|
Other appliances, articles and products for personal care |
2.7 |
–0.5 |
–0.013 |
|
March 2015, against March 2014 |
|||
|
|
|
|
|
|
Catering services of restaurants, cafés and the like |
2.7 |
5.4 |
+0.131 |
|
Coffee, tea and cocoa |
1.1 |
9.1 |
+0.092 |
|
Fruit |
1.6 |
5.6 |
+0.090 |
|
Tobacco products |
2.3 |
3.8 |
+0.088 |
|
Spirits |
2.6 |
3.3 |
+0.085 |
|
Dwelling rental services |
0.6 |
13.8 |
+0.075 |
|
|
|
|
|
|
Fuels and lubricants |
6.2 |
–14.5 |
–1.035 |
|
Solid fuel |
2.0 |
–13.8 |
–0.293 |
|
Heat energy |
2.8 |
–7.7 |
–0.234 |
|
Gas |
1.2 |
–18.0 |
–0.233 |
|
Milk and milk products, cheese and eggs |
4.0 |
–4.1 |
–0.167 |
|
Electricity |
2.5 |
–6.3 |
–0.156 |
The overall change in consumer prices is influenced not only by the size of the
price change for a certain product but also by the relative share (weight) of
expenditure on that product in the total consumption expenditure.
Concepts
Deflation is a long-lasting decrease in the general price level, resulting in an increase in the purchasing power of money.
Inflation is a long-lasting increase in the general price level, resulting in a decrease in the purchasing power of money. Inflation is usually calculated based on the consumer price index and expressed in per cent.
Annual inflation shows the relative change in the average price level between the reporting month and the corresponding month of the previous year.
Average annual inflation shows the relative change in the average price level between the last twelve months and the corresponding previous twelve months.
A press release on the April 2015 CPI is due on 11 May 2015.


 «The Baltic Course» Is Sold and Stays in Business!
