Estonia, Good for Business, Innovations, Internet, Technology
International Internet Magazine. Baltic States news & analytics
Wednesday, 07.01.2026, 22:20
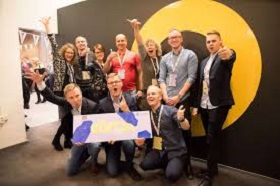
Net Group wins Estonia's 1st data visualization hackathon
 Print version
 |
|---|
The solution created by Net Group helps save on costs and
provides government with the possibility to make effective decisions in
governance of the state.
"The emotions are very good. Actually we started
cooperation with Statistics Estonia already last year and we came to the
hackathon because this field genuinely interests us. We just did what we like
doing very much," said Raigo Raid, a member of the winning team.
"The hackathon went well beyond expectations. For us as
organizers, it was so motivating to see 13 teams devise a solution in 24 hours
for how to visualize statistics in a clearer and innovative manner,"
Annika Brauer, head of the business technology department at Statistics
Estonia, said.
She added that Statistics Estonia definitely wishes to
publish the works also on its own channels.
In addition to Estonian teams, participating teams came from
Germany, Denmark and Lithuania. Places two and three went to teams Hundred
Estonians and minust.ee. The audience's favorite was Racing Charts.
The 26-hour event organized by Garage48 and Statistics
Estonia offered participants a unique opportunity to provide the producer of
national statistics with a pictorial solution of the data and thereby influence
decisions of the consumers of statistics, that is all of us, in the future, the
organizers said.
Statistics Estonia provided the terms of reference for the
event along with data sets. It was up to each team to decide what data to use.
Suitable were the so-called front-end programmed solutions, animated codes,
moving pictures and videos, that is all that makes data come to life.


 «The Baltic Course» Is Sold and Stays in Business!

